Poverty

Kerala’s Extreme Poverty Eradication Programme: A Model of Inclusive Governance

Context: On November 1, 2025, Kerala will be officially declared free from extreme poverty, becoming the first Indian state to achieve this distinction.
The milestone marks the culmination of the Extreme Poverty Eradication Programme (2021–2025) — a four-year, data-driven initiative combining welfare convergence, local governance, and digital innovation.

image 51

About Extreme Poverty

  • Definition: According to the World Bank, extreme poverty refers to living on less than $2.15 per day, representing a state where individuals cannot meet basic needs like food, shelter, and healthcare.
  • Updated Benchmark (2025): The World Bank has revised this threshold to $3 per day (PPP 2021) for low-income nations, accounting for inflation and changing consumption patterns.
  • Measurement: The poverty line is determined using Purchasing Power Parity (PPP) and Household Consumption Expenditure Survey (HCES) data, ensuring comparability across regions.

Extreme Poverty Eradication Programme (2021–2025)

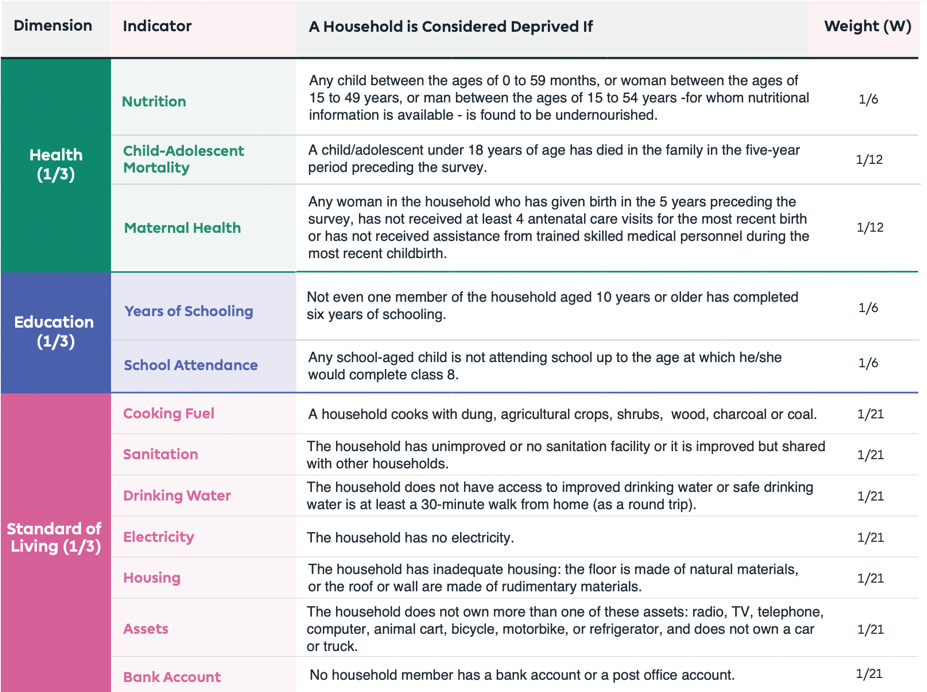
Launched in 2021, the programme aimed to eradicate extreme poverty through a multidimensional approach focusing on nutrition, health, housing, education, and livelihoods.

  • Implementation Agency:
    Led by Kudumbashree – Kerala State Poverty Eradication Mission, in collaboration with local governments.
  • Beneficiary Identification:
    • 64,006 extremely poor families identified through door-to-door surveys.
    • 59,277 families uplifted by 2025.
  • Infrastructure Support:
    • 3,913 houses constructed.
    • 1,338 families provided land ownership.
    • 21,263 individuals received essential IDs (ration, Aadhaar, pension).
  • Technology Use:
    Every household was geo-tagged, and micro-plans were prepared to ensure sustainable rehabilitation.

How Kerala Achieved Poverty-Free Status

  1. Data-Driven Targeting:
    The Smart Panchayat Project and Kudumbashree database enabled accurate beneficiary identification using community validation and GIS mapping.
  2. Convergence of Schemes:
    Integrated State and Central welfare schemes under a unified action plan:
    • Life Mission: Housing for landless families.
    • Aardram Mission: Primary healthcare access.
    • Ashraya Project: Welfare for destitute and elderly.
  3. Decentralised Governance:
    Kerala’s People’s Plan Campaign (Janakeeya Aasuthranam) empowered local bodies with decision-making and fiscal autonomy under the Nava Kerala Mission.
  4. Digital Governance:
    The Kerala State IT Mission created GIS-based dashboards and the e-Sevanam portal for tracking benefits, asset mapping, and real-time monitoring.
  5. Political and Institutional Alignment:
    Cross-party support and Mission Mode Governance ensured coherence between state policies and local implementation, supported by KILA training for officials.

Significance

Kerala’s success underscores the potential of decentralisation, data integration, and community participation in addressing poverty.

It sets a replicable model for other Indian states to adopt evidence-based social welfare and multidimensional poverty reduction strategies.

India Needs a Thali Index 

Context: Thali Index shows real hunger, urging a shift from calorie-based to practical, food-based poverty measures in India.

Relevance of the Topic: Prelims: Poverty estimates in India.  Mains: Issues with current poverty estimates.

Poverty Estimates in India

  • Officially approved poverty measurement in India has involved estimating the level of consumption expenditure sufficient to enable the minimum calorie intake necessary for living and working. If a person could afford food that gave them a certain number of calories (2400 cal in rural areas, 2100 cal in urban areas), they are not considered poor. 
  • Committees like Tendulkar and Rangarajan suggested updates, but India has not revised its official poverty line since 2011-12. 
  • This calorie-focused approach does not match how people actually live today. It ignores how expensive health, transport, and education have become.

Thali Index - A new approach:  

  • A “thali” is a traditional Indian meal with rice or roti, dal, and vegetables. Indians recognise the thali as a fairly complete and nutritionally balanced unit of food consumption. 
  • CRISIL estimated that in 2023-24, the cost of one such home-cooked thali was around ₹30. The researchers found that: 40% of rural Indians and 10% of urban Indians could not afford two thalis a day.
  • This paints a very different picture than the reports from SBI or the World Bank.
    • SBI reported a remarkable decline in rural poverty, estimated at 4.86% in FY24 and urban poverty estimated at 4.09%.
    • The World Bank’s report pegged “extreme poverty” at 2.8% for rural India and 1.1% for urban India in 2022-23.

Why does this gap exist?

  • Most poverty estimates look at total consumption spending. But in real life, people must first pay for essential expenditures like housing, transport, health, education, etc. Expenditure on food ends up as the residual expenditure. 
  • That is why measuring actual food spending, like how many thalis one can buy, gives a clearer picture of people’s living conditions.

Benefits of Thali Index: 

  • Thali Index can help make welfare schemes like PDS or food subsidies more targeted.
  • It pushes policymakers to consider real-life costs people face, not just abstract numbers.
  • It throws light on hidden hunger and malnutrition.

Limitations of Thali index:  

  • Thali prices vary between cities and villages, and across seasons.
  • The Index focuses on food and may miss out on other aspects like schooling, sanitation, or shelter.

What can be done?

  • Use the Thali Index along with other tools like the Multidimensional Poverty Index.
  • Regularly update poverty measures to reflect current spending habits.
  • Eliminating the food subsidy at the upper reaches of the distribution while enhancing it at the lower levels.

India has made significant gains in income-based poverty reduction, but food deprivation persists at large. It is time to move beyond calorie counts to more practical indicators like the Thali Index, which  focuses on real hunger and basic human needs.

Extreme Poverty in India down to 5.3% in 2022-23: World Bank

Context: According to the latest World Bank data on poverty levels across the world, India has recorded a sharp decline in extreme poverty. Despite the World Bank raising the threshold, India achieves a big dip in extreme poverty

Relevance of the Topic: Prelims: Key facts related to World Bank latest data on extreme poverty.

India has recorded a sharp decline in extreme poverty over the past decade, as per the latest World Bank estimates even under a higher global poverty benchmark.

Decline in Extreme Poverty in India

The World Bank revised the extreme poverty threshold to $3 per day (2021 PPP), a 15% increase from the earlier $2.15/day standard (adjusted for inflation from 2017-2021).

  • Based on the revised extreme poverty threshold, India's extreme poverty rate fell from 27.1% in 2011-12 to 5.3% in 2022-23. 
  • The number of people living in extreme poverty in India fell from 344.47 million to 75.24 million over this period. Nearly 270 million were lifted out of extreme poverty during the same period.
  • Poverty rate: In 2024, about 54.7 million Indians lived on less than $3/day. This equals a poverty rate of 5.44% (2021 PPP).
  • The World Bank sets different poverty lines depending on the income level of countries. The poverty line for lower-middle income countries of $4.2 per day (revised upwards from $3.65), India’s poverty rate declined from 57.7% in 2011-12 to 23.9% in 2022-23.
image 21

Data used by World Bank

  • The World Bank used Household Consumer Expenditure Survey data as a proxy for income, but removed ‘lumpy expenditures’ such as hospitalisation, durable expenses and house rental values. The government conducted two rounds of household consumption expenditure surveys for 2022-23 and 2023-24.
  • HCES 2023-24 adopted the Modified Mixed Recall Period method (to capture different items of consumption), replacing the Uniform Reference Period (URP). The MMRP method used different recall periods (7 days, one month, one year) for different items while the URP uses the same reference period for all items.

Decline in Multidimensional Poverty & Inequality in India: 

  • Earlier, NITI Aayog had estimated that multidimensional poverty in India had also registered a steep decline from 55.34% in 2005-06 to 14.96% in 2019-21. This estimate of poverty was based on 12 indicators and drew on data from the National Family Healthy Surveys.
  • The World Bank estimated that inequality in India based on the Gini Index fell from 28.78 in 2011 to 25.51 in 2022. However, these estimates of inequality are based on the household consumption expenditure data, which typically tends to be lower than estimates based on household income.

Need for an Official Poverty Line: 

  • The country lacks an official estimate of poverty, and needs to incorporate income or expenditure metrics in poverty measurement. 
  • The Rangarajan Committee (2014) provided a revised poverty line, but it was never officially adopted. 
  • The existing Multidimensional Poverty Index (MDPI), unlike the Human Development Index, fails to include income or expenditure measures.

Government Interventions in Poverty Reduction

India’s success in reducing poverty has been supported by a range of targeted welfare schemes, such as:

  • MGNREGA
  • National Food Security Act (NFSA)
  • Pradhan Mantri Garib Kalyan Anna Yojana (PMGKAY)
  • Pradhan Mantri Jan Dhan Yojana (PMJDY)
  • Direct Benefit Transfer (DBT)
  • Ayushman Bharat PMJAY
  • Deendayal Antyodaya Yojana NRLM
  • PM-KISAN
  • Pradhan Mantri Awas Yojana (PMAY)
  • Ujjwala Yojana (PMUY)

These schemes have played a crucial role in addressing income, food, health, and housing insecurity among India’s poor.

Multidimensional Poverty

Context: According to Niti Aayog, India’s multidimensional poverty rate has reduced to 11.28% in 2022-23 from 29.17% in 2013-14.

image 75

Findings of NITI Aayog:

  • It estimated that around 24.82 crore people escaped multidimensional poverty in the last nine years.
  • States like Uttar Pradesh, Bihar, Madhya Pradesh, and Rajasthan recorded the sharpest decline in the number of people classified as poor.
  • Indicators in the standard of living dimension showed highest levels of deprivation in 2005-06. For instance, 74.4 per cent of the population was deprived of cooking fuel in 2005-06, which fell to 43.9 per cent between 2019-21. 
  • Similarly, 70.92 per cent of the population was deprived of adequate sanitation facilities in 2005-06, which reduced to 30.93 per cent between 2019-21.
  • Bihar recorded a 53 per cent drop from 56.3 per cent share of MPI poor in 2013-14 to 26.59 per cent in 2022-23.

About Multidimensional Poverty:

  • Multidimensional poverty encompasses the many deprivations that people can experience across different areas of their lives. This could include a lack of education or employment, inadequate housing, poor health and nutrition, low personal security, or social isolation.
  • Applying a narrow definition of poverty and focusing on one dimension alone, such as income, fails to capture the true reality of people’s circumstances. In contrast, multidimensional poverty measurement offers a more holistic approach which better reflects peoples lived experiences.

About Multidimensional Poverty Index (MPI): 

  • Global MPI:  Developed by Oxford Poverty & Human Development Initiative (OPHI) in collaboration with the UN Development Programme (UNDP), in its flagship Human Development Report since 2010 and is the most widely used non-monetary poverty index in the world. It captures overlapping deprivations in health, education and living standards.
  • These dimensions are broken into ten indicators, including child mortality, nutrition, years of schooling, school attendance, cooking fuel, sanitation, drinking water, electricity, housing, and assets.

g3JuZUPK8A vDZ16Jq3Q vxluUIIElwij7AQr5CHZ

  • National MPI: Niti Aayog released its Multidimension Poverty Index in 2021 for the first time.
  • India’s national MPI is a contribution towards measuring progress on target 1.2 of the SDGs which aims at reducing “at least by half the proportion of men, women and children of all ages living in poverty in all its dimensions.

Government initiative to reduce poverty in all dimensions:

  • Poshan Abhiyan: To reduce malnutrition and stunting in children, adolescent girls, and women. It focuses on promoting a healthy diet, proper nutrition, and addressing related health issues.
  • Anemia Mukt Bharat: This initiative is part of the larger Poshan Abhiyan and focuses specifically on preventing and reducing the prevalence of anemia among women, children, and adolescents.
  • Targeted Public Distribution System under the National Food Security Act: Covers 81.35 crore beneficiaries, providing food grains to rural and urban populations. 
  • Pradhan Mantri Garib Kalyan Anna Yojana: Provide additional free food grains to the poor and vulnerable sections of society to alleviate the hardships faced due to the COVID-19 pandemic. 
  • Ujjwala Yojana : To provide free LPG connections to women from below-poverty-line households.
  • Saubhagya:  Providing electricity to rural and urban areas, aiming to enhance the quality of life and economic development.
  • Swachh Bharat Mission: To achieve universal sanitation coverage and make India open-defecation free.
  • Jal Jeevan Mission: To provide piped water supply to all rural households by 2024.
  • Pradhan Mantri Jan Dhan Yojana: To provide access to banking services for all households.
  • PM Awas Yojana: To facilitate access to affordable housing for the low and moderate-income residents of the country.

Significance of multidimensional poverty:

  • It is qualitative measure of poverty and it used non-monetary metrics to measure poverty in the world by measuring overlapping deprivations in access to health, education and living standards. 
  • Monetary measures of poverty based on poverty lines only give headcount ratios i.e., number of people who are poor. However, these measures fail to measure depth of poverty. It is possible that while the overall number of poor individuals reduce, while at the same time the poorest get poorer. Also, gains in quality of life may be completely missed unless the poor cross the poverty line or exit poverty. 
  • Thus, MPI provides insights not just into the distribution of poverty within a country but also indicates contribution of each indicator to multidimensional poverty. 
  • Using MPI, it has been possible to device schemes which target specific deprivations.
  • Helps to create a comprehensive understanding of poverty by identifying who is poor and the manner in which they experience poverty.

Limitations with MPI: 

  • It does not capture intra-household inequality or inequality among the poor.
  • The multitude of indicators can be overwhelming and may result in ineffective implementation.
  • Determining the relevance of dimensions and deciding how many should be considered or prioritized is also challenging.
  • Poverty is a complex issue with numerous factors, making it challenging to address all aspects.
  • Collecting data for multidimensional indicators can be extremely challenging and demanding, requiring additional efforts from the agency to achieve meaningful results.
  • MPI data released by NITI Aayog based on the National Family Health Survey (NFHS), which raises the issues of reliability of poverty assessments and subsequent policy decisions. (no independent assessment by NITI Aayog).

Way forward:

  • Integrating the Multidimensional Poverty Index (MPI) with government policy measures can indeed enhance the effectiveness and precision of schemes like the Public Distribution System (PDS) and the Mahatma Gandhi National Rural Employment Guarantee Act (MGNREGA).
  • Simplify the set of indicators to avoid overwhelming complexity. Prioritize the most relevant and impactful dimensions, taking into account the local context and priorities. This will help focus efforts on the most critical aspects of poverty.
  • Involve local communities in the data collection process to enhance accuracy and inclusivity.
  • Baseline survey should be conducted with the involvement of local communities to enhance accuracy and inclusivity.

National Multidimensional Poverty Index-Progress Report 2023 by NITI Aayog

Context: India aims to reduce poverty in all its forms by at least half by 2030 (SDG target 1.2). To measure India's progress in this respect, NITI Aayog has developed an indigenised index to monitor and address multidimensional poverty. The baseline edition of national multidimensional poverty index was launched in 2021. This present second edition of National MPI has been developed based on National Family Health Survey-5 (NFHS-5).

Indicators and weights used in MPI

MPI is measured based on three broad indicators of deprivations in health, education and standard of living each having equal weights:

image 50

Indicators and theirs weights

  • Headcount Ratio: Proportion of multidimensionally poor in the population, which is arrived at by dividing number of multidimensionally poor reasons by total population.
  • Intensity of Poverty: Average proportion of deprivations which is experienced by multidimensionally poor individuals. To compute intensity, the weighted deprivation scores of all poor people are summed and then divided by the total number of poor people. 
  • MPI value is arrived at by multiplying the headcount ratio (H) and intensity of poverty (A), reflecting both the share of people in poverty and the degree to which they are deprived. 

MPI = H X A

Methodology of India's National MPI: Alkire Foster Methodology

MPI is computed using the Alkire-Foster Methodology which is a globally accepted general framework for measuring multidimensional poverty that poor people on a dual-cutoff counting method.

Significance of multidimensional poverty

  • MPI has been developed by UNDP & Oxford Poverty & Human Development Initiative (OPHI). The statistics from this metric is used by UNDP to measure levels of poverty across the globe in its Human Development Report.
  • Multidimensional Poverty is qualitative measure of poverty and it used non-monetary metrics to measure poverty in the world by measuring overlapping deprivations in access to health, education and living standards.
  • MPI captures additional information not measured by monetary measures of poverty such as broader qualitative aspects of life, child mortality, housing conditions and other basic services such as water and sanitation.
  • Monetary measures of poverty based on poverty lines only give headcount ratios i.e., number of people who are poor. However, these measures fail to measure depth of poverty. It is possible that while the overall number of poor individuals reduce, while at the same time the poorest get more poor. Also, gains in quality of life may be completely missed unless the poor cross the poverty line or exit poverty. 
  • Thus, MPI provides insights not just into the distribution of poverty within a country but also indicates contribution of each indicator to multidimensional poverty. 
  • Using MPI, it has been possible to device schemes which target specific deprivations. 

MPI Progress Report 2023

MPI Progress Report 2023

Steep decline in Poverty Headcount Ratio from 24.85% in 2015-15 to 14.96% in 2019-21. This indicates that India is well on course to achieve the SDG target 1.2 much ahead of 2030. At the same time, the Intensity of Poverty, which measures the average deprivation among the people living in multidimensional poverty also reduced from 47.14% to 44.39%.

image 52

Regional/State-wise distribution of Multidimensional Poverty Index

Regional/State-wise distribution of Multidimensional Poverty Index

Analysis: Bihar, Jharkhand and Meghalaya fare the worst on the Multi-dimensional poverty index. Southern states of Maharashtra, Telangana, Andhra Pradesh, Tamil Nadu, Kerala, Karnataka, Punjab, Haryana & Himachal Pradesh.

Bihar, the state with the highest MPI value in NFHS-4 (2015-16), saw the fastest reduction in MPI value in absolute terms with the proportion of multidimensional poor reducing from 51.89% to 33.76% in 2019-21. The next fastest reduction in the MPI value was seen in Madhya Pradesh and Uttar Pradesh

NITI Aayog report says 13.5-cr. people lifted out of multidimensional poverty

Context: India has registered a significant decline of 9.89 percentage points in the number of multidimensionally poor, from 24.85% in 2015-16 to 14.96% in 2019-2021, says the “National multidimensional poverty index: a progress review, 2023”, released by NITI Aayog recently.

Findings of the report

oZcB Q4uoabZhnPMATWmvRO40HyYXPWZyZz6XK2XnS ZjdZvBzQ5zTE E IzS eEJtd5xI96rnHpcAzcC5baa49DrHPKrLn0tVrTpHiwp3fcD6uvVzZl9l q9lvztg6YV5VyYrQ4AKY3M40n92utHEE
  • The study says nearly 13.5 crore people came out of multidimensional poverty during the period, assessed by identifying “acute deprivations in health, education and standard of living” using United Nations-approved parameters.
  • The report said rural areas witnessed the fastest decline in poverty from 32.59% to 19.28%, mainly due to a decrease in the number of multi-dimensionally poor in States such as Bihar, Uttar Pradesh, Madhya Pradesh, Odisha, and Rajasthan.
  • Delhi, Kerala, Goa, and Tamil Nadu have the least number of people facing multidimensional poverty, along with the Union Territories.
  • Bihar, Jharkhand, Meghalaya, Uttar Pradesh, and Madhya Pradesh top the chart where the percentage of the population which is multidimensionally poor is high.
  • Multidimensional poverty in urban areas, during the same period, saw a decrease from 8.65% to 5.27%.
  • Uttar Pradesh registered the largest decline in the number of poor with 3.43 crore people escaping multidimensional poverty.

About National Multidimensional Poverty Index (MPI)

  • The report has been prepared based on the latest National Family Heath Survey of 2019-21 and is the second edition of the National Multidimensional Poverty Index (MPI).
  • The broad methodology followed is in consonance with the global methodology.
  • It said 12 parameters of health, education, and standard of living are examined in the report.

Poverty & UNDP

Context: The UN report noted that deprivation in all indicators declined in India and “the poorest States and groups, including children and people in disadvantaged caste groups, had the fastest absolute progress.”

image 37

Different types of Poverty 

Absolute Poverty 

Absolute poverty means poverty defined using a universal baseline with no reference to other people’s income or access to goods. The failure of meeting this baseline thus means that the individual is poor.

It incorporates the deficiency of basic food, clean water, prosperity, refuge, guidance and information and puts a money value on them to calculate a baseline. 

Relative Poverty 

Relative poverty is the level of poverty which changes depending on the context–it’s relative to the economic context in which it exists. Relative poverty is present when a household income is lower than the median income in a particular country.

For example, if the disposable income of a household is less than 50% of the median income of the country the household is relatively poor.

Situational Poverty 

Situational poverty occurs when “a family temporarily experiences financial constraints due to an illness, job loss, or other temporary event”.

Generational Poverty 

Generational poverty is a condition in which poverty has become a familial pattern for at least two generations, although it typically affects multiple generations. Sometimes, situational poverty may lead to Generational poverty.

Subjective Poverty 

Subjective poverty is an individual’s perception on his or her financial/material situation. This kind of Poverty is defined on the basis of individual feeling, i.e., those who say that they feel poor represent subjective poverty.

Different Methods of measuring Poverty

Head Count Ratio or Poverty Ratio 

Absolute poverty may be measured by the number or ‘head count’ of those whose incomes fall below the ‘poverty line’. Head Count Ratio is the percentage of that population in the total population.  

Multi-dimensional Poverty 

Multidimensional poverty encompasses the many deprivations that people can experience across different areas of their lives. This could include a lack of education or employment, inadequate housing, poor health and nutrition, low personal security, or social isolation.

In 2005/2006, about 645 million people were in multidimensional poverty in India, with this number declining to about 370 million in 2015/2016 and 230 million in 2019/2021.

Multidimensional Poverty Index (MPI) is released by the United Nations Development Programme (UNDP) and the Oxford Poverty and Human Development Initiative (OPHI)

The MPI as a poverty index can be pictured as a stacked tower of the interlinked deprivations experienced by poor individuals, with the aim of eliminating these deprivations.

nNCNmj tCyDZ52 grEM8852tf2famHQokFlMcKOxqfmV2TvVT9jCmjDztqLLvX8hAADFTG5rGH8Yt2fVMLo WGFkz

Source UNDP

Causes of improvement 

During the last two decades, India has implemented several social protection programmes with the aim to improve living standards, and these have helped the Indian government in poverty reduction.

  • Implementation of the Mahatma Gandhi National Rural Employment Guarantee Act (MGNREGA) since 2006 has significantly increased household consumption and accumulated more nonfinancial assets.
  • Minimum Support Price (MSP), Public Distribution Systems (PDS), PM-POSHAN and other programmes have addressed the problem of food security. 
  • Code on social security, Code on wages etc. have increased labour earnings and security of job which played significant roles in poverty reduction.
  • PM- Jan Dhan Yojana and biometric identity cards under Aadhar have also transformed the anti-poverty programmes by replacing the current cumbersome and leaky distribution of benefits under various schemes using the Direct Benefit Transfers (DBT) programme. 
  • Saubhagya scheme, PM-Sahaj Har Ghar Bijali Yojana etc. helped in improving the standard of living.
  • Swachh Bharat mission, National Rural Drinking Water Programme, Total Sanitation Campaign, Jalmani Programme etc. have helped in improving the sanitation outcomes.
B 7 rtirwmZxhnM2DDOcb4jrlWmuP6HUBOd g4H6VbLj3b28D2ZxRwe6oMPY9anEYayY3OhKwTshsLjxZ7dyde9PQCy8wpHqMq5FrsELMGKHXClzjaY15gFz7qJab ssGkAcYM 8lpKcJYHFv DHtg

Current status of MPI in India

India was among the 19 countries that halved their global Multidimensional Poverty Index (MPI) value during one period - for India it was 2005/2006–2015/2016.

  • According to the report, people who are multidimensionally poor and deprived under the nutrition indicator in India declined from 44.3% in 2005/2006 to 11.8% in 2019/2021, Child mortality fell from 4.5% to 1.5%.
  • Those who are poor and deprived of cooking fuel fell from 52.9% to 13.9% and those deprived of sanitation fell from 50.4% in 2005/2006 to 11.3% in 2019/2021.
  • In the drinking water indicator, the percentage of people who are multidimensionally poor and deprived fell from 16.4 to 2.7 during the period, electricity (from 29% to 2.1%) and housing from 44.9% to 13.6%.

Way Forward

  • Government may focus on the implementation of programmes which faces the problem of rigidity, non-adaptability to local conditions, late disbursement of funds, reallocation of funds to unrelated recurring expenditure, and wide-ranging rent-seeking practices. 
  • DBT, technological improvement Programmes and sanitation programmes has been criticised because of digital divide and urban biasness in their implementation. Through initiatives for education and awareness, the Indian government could enhance the implementation its policies.

The wide disparities in human development

Today’s Hindu newspaper (21st march 2023) has an article on disparities in human development. with the help of this article, we will analyse the various aspect of human development in India.

What is Human Development?

The United Nations Development Programme defines human development as "the process of enlarging people's choices", said choices allowing them to "lead a long and healthy life, to be educated, to enjoy a decent standard of living", as well as "political freedom, other guaranteed human rights and various ingredients of self-respect".

How to measure human development?

United Nations Development Programme created Human Development Index to evaluate and compare the level of human development in different regions around the world. It was introduced in 1990 as an alternative to conventional economic measures such as Gross Domestic Product (GDP), which do not consider the broader aspects of human development. 

The HDI assesses a country’s average accomplishment in three aspects: 

  • long and healthy life (life expectancy at birth)
  • knowledge (Mean year of schooling, expected years of schooling)
  • a decent standard of living (Gross national income per capita)

Disparities in Human development in India

The five States with the highest HDI scores are Delhi, Goa, Kerala, Sikkim, and Chandigarh. Delhi and Goa have HDI scores above 0.799, which makes them equivalent to countries in Eastern Europe with a very high level of human development.

The bottom five States are Bihar, Uttar Pradesh, Madhya Pradesh, Jharkhand, and Assam, with medium levels of human development. This category also includes States such as Odisha, Rajasthan, and West Bengal, which have HDI scores below the national average. The scores of these low-performing States resemble those of African countries such as Congo, Kenya, Ghana, and Namibia.

Does high GDP necessarily translate into high HDI?

No, it is not true because despite having the highest SGDP per capita among larger States, Gujarat and Haryana have failed to translate this advantage into human development and rank 21 and 10, respectively.

Conversely, Kerala stands out with consistently high HDI values over the years, which can be attributed to its high literacy rates, robust healthcare infrastructure, and relatively high-income levels.

Bihar, however, has consistently held the lowest HDI value among the States, with high poverty levels, low literacy rates, and poor healthcare infrastructure being the contributing factors.

What are the reasons behind regional disparities in India?

Unevenly distributed economic growth: The top 10% of the Indian population holds over 77% of the wealth. This has resulted in significant disparities in access to basic amenities, healthcare and education.

Poor quality of services: While India has made significant progress in reducing poverty and increasing access to healthcare and education, the quality of such services remains a concern. For example, while the country has achieved near-universal enrolment in primary education, the quality of education remains low. 

How to reduce these disparities in human development?

This requires a multi­faceted approach which includes

  • Address income inequality and gender inequality; 
  • Improve access to quality social services; 
  • Address environmental challenges; 
  • Greater investment in social infrastructure such as healthcare, education, and basic household amenities including access to clean water, improved sanitation facilities, clean fuel, electricity and Internet in underdeveloped States.
  • Investment in human development and job creation, particularly for its youth