Context: The European Union’s approval this week of new deforestation regulations poses a threat to Indian exports of items like coffee, leather, paper and wooden furniture.
What is the law?
The EU Deforestation-free Regulation (EUDR) is the new EU initiative to limit deforestation caused by forestry and agricultural activities all over the world.
EU Deforestation-free regulation (EUDR) defines those obliged as ‘operators’ and ‘traders’. Operators (companies who first place products in the single market) will be required to implement the due diligence on their supply chains to ensure they are deforestation and forest-degradation-free, while traders will be responsible for storing and sharing information on their supply chain to operators.
The legislation seeks to prohibit products such as palm oil, coffee, cattle, cocoa, rubber, soya, timber, printing paper and derived products in the EU, that came from land that was deforested after December 31, 2020. The rules cover imports and domestic production.
Four levels of penalties have been planned for any violations of this norm, which include monetary fines up to 4% of a firm’s annual turnover in the EU, confiscation of products, confiscation of revenues gained from a transaction and exclusion from public procurement processes.
To implement the regulation, the EU, within 18 months from now, will classify countries as low, standard, or high-risk. High-risk countries must meet more obligations and be subject to more checks. For instance, EU Customs will check 9% of firms or consignments from high-risk countries, 3% from standard-risk countries, and 1% from low-risk countries
Issues:
The EU itself has extensively expanded agricultural land by cutting down primary forests, which now account for less than 0.7% of its total forest area, compared to the global average of 33%.
Many other countries, facing the need to convert primary forests into cultivable land to feed growing populations will stand at loss.
Arbitrary categorization of countries violates both the national treatment and most favoured national principles of the WTO
Conclusion
EU Deforestation Regulation appears to use real issues of deforestation to promote its selfish interests by prioritising its own farm sector and making imports difficult
Context: Both agricultural exports from and imports into India have scaled new highs in the fiscal year that ended March 31, 2023. Provisional data from the Department of Commerce shows total farm exports at $53.15 billion and imports at $35.69 billion during 2022-23, surpassing their previous year’s records of $50.24 billion and $32.42 billion respectively.
Basic driver: Global prices
The UN Food and Agriculture Organization’s Food Price Index (FPI) is a weighted average of world prices of a basket of food commodities over a base period value (2014-16=100)
The FPI had crashed from an average of 119.1 points in 2013-14 to 90 points in 2015-16. As a result, exports sharply fell from $43.25 billion to $32.81 billion between 2013-14 and 2015-16. However, imports continued to rise, bringing down the farm trade surplus from a peak of $27.72 billion in 2013-14 ($21.46 billion net of fertiliser imports) to a low of $8.05 billion by 2016-17.
The FPI since then had recovered to 102.5 points by 2020-21, and further to 133 points in 2021-22 and 139.5 points in 2022-23, which made India’s agri-commodities more globally price competitive. This has led to a rise in exports to $41.90 billion, $50.24 billion and $53.15 billion during these three years.
Major export contributors
In recent times, India’s agri exports have been powered by three items, i.e. Marine products, rice and sugar.
Marine products: Exports have grown steadily from $5.02 billion in 2013-14 to $8.08 billion in 2022-23.
Rice: Exports have also gone up during this period, from $7.79 billion to $11.14 billion. But it’s been driven by non-basmati rice, with the value of premium-priced basmati shipments actually declining. Basmati exports are mainly to the Persian Gulf countries and, to some extent, the US and UK. Non-basmati shipments are more diversified, with the destinations spread across Asia (Bangladesh, China, Sri Lanka, Malaysia, Vietnam, UAE and Iraq) and Africa (from Senegal, Ivory Coast and Benin to Somalia and Madagascar). It’s non-basmati that has made India the biggest rice exporter, ahead of Thailand.
Sugar: The boom in sugar exports has been more recent – from a mere $810.90 million in 2017-18 to $5.77 billion in 2022-23. Indian mills have built markets for both raw sugar (among refineries in Bangladesh, Indonesia, Malaysia, Saudi Arabia and Iraq) and regular plantation whites (in African countries, Afghanistan, Sri Lanka and China). In the process, the country has emerged as the world’s No. 2 exporter after Brazil.
Traditional items that are lagging behind
Spices exports: have stagnated since it last jumped from $2.5 billion in 2013-14 to almost $4 billion in 2020-21. The jump was due to chilli, mint products, cumin, turmeric, ginger, coriander, fennel and other seed spices and not due to traditional plantation spices such as pepper and cardamom.
Buffalo meat shipments: Never regained their peak of $4.78 billion reached in 2014-15.
Raw cotton, guar-gum and oil meals: Exports of the three in 2022-23 were a pale shadow of their highs of 2011-12 ($4.33 billion for cotton) and 2012-13 ($3.92 billion for guar-gum and $3.04 billion for oil meals).
Cotton: Cultivation of genetically-modified Bt cotton and high global prices has enabled India to become the world’s top producer (ahead of China) and No. 2 exporter (after the US) of the natural fibre. But with the yield gains from Bt cotton tapering off and the regulatory regime not permitting new gene technologies, the country has turned from a net exporter to an importer of cotton.
Guar-gum (a thickening agent used in extraction of shale oil and gas) and oil meal exports rode the global commodity price boom from 2003-04 to 2013-14. They haven’t shown the same buoyancy in the more recent post-Covid boom, partly due to domestic crop shortages – especially in cotton and soybean – not generating adequate surpluses for exports.
Major Import Contributors
Unlike exports, India’s imports of farm produce are dominated by a handful of items.
Vegetable Oil: Imports have more than doubled in value terms, from $9.67 billion to $20.84 billion between 2019-20 and 2022-23. In quantity terms, imports have risen from 13.18 million tonnes (mt) in the 2019-20 oil year (November-October) to 14.03 mt in 2021-22. During November-March 2022-23, they have grown further by 23.7% over the same period of the previous oil year. Imports meet roughly 60% of India’s vegetable oil requirements.
Pulses: Import dependence is hardly 10% now in pulses, with the value of imports also coming down from $4.24 billion (6.7 mt) in 2016-17 to $1.94 billion (2.5 mt) in 2022-23.
Spices, cashew and cotton: commodities where India has traditionally been a net exporter – have shown a rising imports trend. Spice imports going up are a reflection of reduced price competitiveness (vis-à-vis Vietnam in pepper and Guatemala in pepper), while an outcome of stagnant, if not falling, domestic production in cotton.
What are Risks to Agricultural Trade?
International prices: The latest FPI reading of 127.2 points for April 2023 is down from the 159.7 points peak of March 2022 and the 2022-23 average of 139.5 points. This reduction in FPI will reduce the competitiveness of Indian agricultural exports.
Domestic inflation: The government had banned wheat exports last May, which was followed by a ban on broken rice exports and the slapping of a 20% duty on all non-parboiled non-basmati shipments in September. Exports of sugar have also stopped since this month’s start.
Conclusion
One can expect more curbs on exports – and a further liberalisation of imports – if the ensuing southwest monsoon season delivers subnormal rainfall.
Context:The Indian government is concerned about El Nino's impact on the upcoming monsoon and has imposed a virtual ban on sugar exports, allowing only up to 6.1 million tonnes.
Sugarcane industry in India
Sugarcane belongs to bamboo family of plants and is indigenous to India.
It is a long duration crop and requires 10-15 months to mature, depending upon the geographical conditions.
It requires hot and humid climate with average temperature of 21° - 27° Celsius.
It usually grows well in areas receiving rainfall varying from 100 to 150 cm.
It can grow on variety of soils including loams, clayey loams, black cotton soils, brown or reddish loams and even laterites.
India is the second largest exporter of sugarcane in the world.
It is a water guzzling crop and is often blamed for worsening water crisis in parched areas of India.
Distribution
The Sutlej – Ganga plain from Punjab to Bihar containing 51% of the total area and 60% of the country’s total production.
The Black soil belt from Maharashtra to Tamil Nadu along the eastern slopes of Western Ghats.
Coastal Andhra and Krishna Valley.
Sugar Industry
Sugar can be produced from sugarcane, sugar-beet or any other crop having sugar content. At present, it is the second largest Agro based industry of India after cotton textile industry.
Localization of Sugar Industry:
The establishment of the sugar industry in India is reliant on sugarcane as its primary raw material, which is heavy, low in value, and has a tendency to lose weight and perish quickly.
Due to the inevitable loss of sucrose content, sugarcane cannot be stored for extended periods of time, and transportation over long distances is not feasible as the transportation costs would increase the overall cost of production, and the sugarcane may dry up en route.
As a result, the sugar industry is typically located in regions where sugarcane cultivation is prevalent.
Distribution of Sugar industry:
Maharashtra dominates the sugar production in India and accounts for over 33% of the total sugar production in the country.
Uttar Pradesh is the second-largest sugar-producing state, with sugar factories concentrated in two regions, the Ganga-Yamuna doab and the terai region.
In Tamil Nadu, the sugar industry is mainly concentrated in Coimbatore and Vellore districts.
The sugar industry in Andhra Pradesh is mainly located in the coastal regions, such as East Godavari, West Godavari, and Vishakhapatnam districts.
Other states that contribute to the sugar production in India are Bihar, Punjab, Haryana, Madhya Pradesh, and Gujarat.
Difference between the Sugar Industry of Northern and Peninsular India
Peninsular India has tropical climate which gives higher yield per unit area as compared to north India.
The sucrose content is also higher in tropical variety of sugarcane in the south.
The crushing season is also much longer in the south than in the north.
The cooperative sugar mills are better managed in south than in the north.
Most of the mills in south are new which are equipped with modern machinery.
Problems of Sugar Industry
Low yield of sugarcane: Although India has the largest area under sugarcane cultivation, the yield per hectare is extremely low as compared to major sugar producing countries.
Short crushing season: Manufacturing of sugar is a seasonal phenomenon with short crushing season varying normally from 4 to 7 months in a year.
Fluctuating Production: Due to fluctuation in production, sugarcane has to compete with several other food and cash crops like cotton, oil seeds, rice, etc.
Low rate of recovery: The average rate of recovery in India is less than 10% which is quite low as compared to other major sugar producing countries.
High cost of production: High cost of sugarcane, inefficient technology, uneconomic process of production and heavy excise duty result in high cost of manufacturing.
Obsolete machinery: Most of the machinery used in Indian sugar mills, particularly those of UP and Bihar is old and obsolete.
Regional imbalances in distribution: Over half of sugar mills are located in Maharashtra and UP and about 60% of the production comes from these states.
Context: The Food Corporation of India (FCI) has procured over 20 million tonnes of wheat this season, with Punjab, Haryana and Madhya Pradesh contributing over 98% of the total to the central pool.
Punjab is expected to be the largest contributor to wheat procurement despite producing less wheat than Uttar Pradesh. Farmers in Punjab who used zero tillage and mulched paddy straw at the time of sowing wheat through smart happy seeders were able to achieve a high yield, while others who experienced heavy rain had lower yields. Mulching paddy straw helps increase organic carbon in soil and can be a good case for India to show to the agriculture group of G20, with Punjab Agricultural University and Borlaug Institute for South Asia leading the way.
Public distribution System (PDS):
The Public Distribution System (PDS) in India was established in June 1947 as a way to ensure that food grains are distributed at affordable prices and to manage emergency situations.
Its primary goal is to provide subsidized food and non-food items to the country's poor population.
By helping to alleviate hunger, malnutrition, Anaemia, and other challenges faced by the poorest members of society, including women and children, PDS has played an important role in promoting socio-economic justice in India.
The PDS is managed jointly by the Central and State/UT Governments.
It works under the Ministry of Consumer Affairs, Food and Public Distribution.
The Central Government, through the Food Corporation of India (FCI), is responsible for procurement, storage, transportation, and bulk allocation of food grains to the State Governments. On the other hand, the operational responsibility, including allocation within the State, identifying eligible families, issuing Ration Cards, and overseeing the functioning of Fair Price Shops (FPSs), falls under the purview of the State Governments.
The PDS currently distributes wheat, rice, sugar, and kerosene to States/UTs for distribution. Some States/UTs also use PDS outlets to distribute other essential items like pulses, edible oils, iodized salt, spices, etc.
Issues in PDS:
Targeting: The targeting of the PDS is often flawed, with many deserving beneficiaries being excluded while others who are not in need receive the benefits.
Leakage and corruption: There are high levels of leakage and corruption in the PDS, with food grains being diverted to the black market or sold to non-eligible beneficiaries.
Poor quality of food grains: The food grains provided through the PDS are often of low quality, with high levels of adulteration and not fit for human consumption.
Inadequate coverage: The PDS does not cover all deserving households, leaving many without access to essential food grains.
Inefficient distribution mechanism: The distribution mechanism of PDS is often inefficient, with delays and irregularities in the supply of food grains to the beneficiaries.
Storage and transportation issues: The storage and transportation infrastructure for the food grains is often inadequate, leading to spoilage and wastage of the grains.
Price disparities: The prices of food grains provided through PDS vary across states, resulting in disparities and discrimination.
Limited nutritional diversity: The food grains provided through PDS are limited in terms of nutritional diversity, leading to malnutrition and health issues among the beneficiaries.
Way Forward:
Professor Ashok Gulati suggests the introduction of more nutritious food in PDS that is climate resilient, such as millets, pulses, and oilseeds.
Upgrading 10% of the five-lakh odd fair price shops as Nutritious Food Hubs (NFHs) and offering electronic vouchers for targeted beneficiaries.
FCI should outsource its stocking operations to various agencies such as Central Warehousing Corporation, State Warehousing Corporation to bring down costs of storage. (Shantakumar committee)
Covered and plinth (CAP) storage should be gradually phased out. The Movement of grains needs to be gradually containerized to reduce transit losses.
End to End computerization to reduce leakages in PDS and setting up of vigilance committees to check pilferage from PDS.
Context: Atal Innovation Mission (AIM) under the NITI Aayoghas released a report on agritech startups.
About Agritech Startups
Startups in developing and emerging economies have experienced rapid growth and successfully provided digital solutions to address several developmental challenges. Agritech startups are startups engaged in various stages of agriculture sector.
Indian agritech start-up sector, even though it has not unlocked its full potential, is way ahead of many countries. More than 330 well-funded matured agritech start-ups spread across sub-sectors like supply chain, e-commerce, precision agriculture, quality management, and financial services. The business models of these start-ups are built around smallholder farmers.
Examples of startups: Boomitra, Ecozone, Skymet, Agrosonic, and Satsure have a presence in different needs,
Characteristics of smallholder farmers
Small and fragmented landholdings
Sustenance of small market surplus & distress selling
Traditional production system
Poor access to market and often dependent on middlemen and multiple intermediaries.
Limited/No access to formal & productive finance.
Limited diversification and mechanisation.
Low productivity and low quality produce.
High risk of crop loss.
Post-harvest loss due to poor supply chain.
Low value capture and lower net realisation of farmers.
Challenges faced by smallholders farmers
PHASE
VALUE CHAIN LEVEL
CHALLENGES
FARM INPUTS
Seed
Lack of access to quality seeds at reasonable prices, dependent on local stores for seed quality.
Fertiliser
High price of fertilisers, non-availability of fertilisers.
Credit
No credit, limited access to formal credit from formal sources, often dependent on input suppliers for credit.
Farm machinery
Traditional equipment used for farm operations.
Pesticides
Quality pesticides or insecticides not available
PRE-HARVEST
Knowledge
Employ traditional methods of production. Not aware of scientific production method.
Disease
Not able to identify diseases and pests or do not know solutions to overcome it.
Crop-selection
Limited varietal knowledge, no know-how about climate smart agriculture, grow what everyone grows.
Harvest
Unscientific harvesting leads to poor quality of produce (Underripe or overripe produce with low quality and low shelf life).
HARVEST
Post-harvest losses
Loss in transportation & storage.
Access to market
Sell-their produce to local middlemen.
Access to agriculture infrastructure
Limited facilities for storing and primary processing of their produce.
Access to credit
No access to credit to meet their post-harvest requirement. Often result in distress selling.
Low uptake of crop and livestock insurance, lack of awareness about insurance products.
Climate change
Low adoption of climate smart agriculture like zero-tillage or natural farming to manage climate risks.
Opportunities for Agritech startups
Large number of smallholdings: Agritech startups can create a disproportionate impact in the lives of smallholder farmers by providing access to credit, insurance, inputs and market linkage at reduced cost with greater linkage. These start-ups can interact with millions of farmers across diverse geographies.
Impact of climate change: With the rise of AI and ML tools coupled with satellite imagery, weather predictions have become increasingly accurate. Thus, climate change allows agritech companies to mitigate weather related risks and advise on climate resilient agriculture practices.
Increased mobile internet & smartphone penetration: The number of mobile internet users and smartphone users have increased significantly particularly among younger generations, but affordability remains an issue. This can be exploited by agritech startups to digitally connect with smallholder farmers and offer their unique and innovative solutions.
Consumer behaviour: Consumer preference for clean, chemical-free and sustainably sourced food has increased with urbanisation and income with consumers willing to pay the premium. Agritech startups can solve issues related to producing clean and chemical free products, supply chain issues and traceability. This will also help smallholder farmers to produce sustainably by adopting best technology and assure consumers that their products are clean, fresh and sourced sustainably.
Increased support from government & incubators: Governments and other stakeholders are increasingly offering support to startups with various schemes and other support.
Agritech solutions in various areas of agriculture
VALUE CHAIN
TECHNOLOGY
Inputs
Digital platform based livestock & farm management – centralises, manages and optimises production activities.Digital app based procurement aggregation to reduce fixed costs and customer service.Data-driven marketplace linkage price discovery.App based expert agronomy advice.Remote and proximity sensing for crop monitoring.Satellite based estimation of harvesting time & period.Digitising production, procurement & cold chain management through IoT.Automatically adjust irrigation volume based on soil moisture, climatic conditions and volume.Drone/UAV surveillance.Digital finance in agriculture.
Farm Production
Standard package of practicesAlert log & management (pest infestation, diseases)Soil testingSatellite & weather input based advisoryReal time crop reports & insightsGeotag based accountability, predictabilityAdherence to compliance & certificationLivestock & farm management software
Post-harvest/Processing
Satellite based yield estimationSensor, data-driven harvesting timeMobile quality testing devicesProactive AI-drivenShipping information management
Digital finance in AgricultureBuyer-seller digital marketplaceDigitally enabled value chain integrationMarket access (off-taker) integrationE-marketplaces/input e-market placeBrand-certification & managementPay-as-you-go agricultural machinery
Supply chain
Blockchain-based supply chain managementFarm to fork traceability of commoditiesPrecision shipping forecast management softwareShipping information managementQuality/compliance certificationsAffordable quality check tools
High cost of infrastructure and devices is a significant barrier to scaling of agritech solutions and subsequent adoption by smallholders.
Lack of digital literacy & cost of device resulting in low adoption of agritech solutions
High cost of customer acquisition due to fragmented landholdings, lack of connections between farmers and agritech startups and lack of trust among farmers towards agritech startups
Inadequate farm and farmer level data set like access to digitalised land records, agricultural and horticulture output
Challenges in cross-border expansion
Challenges specific to growth phase
Lack of human quality resources
Lack of availability of funding or grant support
Tremendous competition in early-stage startups
Scalability of start-ups
Way Forward:
Improving Last Mile Connectivity: Due to fragmented landholdings and lack of digital literacy most agritech startups depend on local institutions like FPOs and NGOs to roll out their solutions. The success of interventions by FPOs depend on the quality and capacity of theselocal institutions. Thus, for agritech startups to be effective significant effort needs to be put into building local institutions.
Access to public data: Government has vast data on farmers, land records, financial health, weather reports, meteorological data, price etc. This data is critical for AI-based start-ups or those start-ups that require maps and data related to land records and soil types. Government should ensure that startups are able to access these data sources to scale up their solutions. Also, at the national level efforts should be made to improve data collection, storage and processing. Karnataka government has implemented e-Sahamathi to solve the 15 issue of data privacy, consent, and data sharing with an interested third party.
Promoting local level of infrastructure for farm-level processing: Startups depend on local infrastructure like warehouses for storage or grading and sorting centre for primary commodities processing. Therefore, government should promote the creation of local agriculture-related infrastructures by incentivising and providing financing from formal financial institutions.
Digitalisation of licensing regime: Many agritech startups working in agriculture inputs often face license related challenges, which are often cumbersome due to opaqueness in processes and limits their scaling. Thus, there is a need for creating transparency around licensing process by digitising the entire process.
State-specific Agritech policy to promote agriculture based start-ups: Only a few states like Delhi and Maharashtra have start-up policies to promote and nurture start-ups. However, agritech startups need different kind of support from other startups. Thus, there is a need for states to formulate separate agritech policies.
Establishment of facilitation centre for Agritech start-ups at local and global level: A state level facilitation centre as one-stop centre should be created to ensure that agritech startups can access public resources or leverage government’s infrastructure. This centre can apprise startups about government policies and help agritech startups meet investors.
Context: NITI Aayog has released a working paper titled India’s White Revolution: Achievements and the Next Phase.
Trends of India's Milk Production
Phase I - From Independence to White Revolution: Before the introduction of White Revolution, the annual growth of milk production was merely 1.36% between 1950-51 to 1973-74 which was less than the growth in population of India.
This led to decline of per capita milk output from 132 grams in 1955-56 to 110 grams in 1973-74 i.e., a drop of 15% in this period. This led to a serious shortage of milk and milk products in India. The shortage was met partly through import and aid in the form of milk powder.
Phase II - From White Revolution: Dairy sector has shown very impressive growth since the beginning of Operation Flood, launched in 1970 to increase milk production. Operation flood resulted in milk production outpacing population growth after 1973/74. Fast growth in milk output enabled India to raise per capita milk production to 387 grams per person per day by year 2018-19 which is higher than average Recommended Dietary Allowance from India.
Phase III - Recent trend in milk production: In last decade, milk production has increased by 5.3% due to shift in emphasis from exotic breeds to indigenous breeds.
Factors contributing to success of White Revolution
Institution of cooperatives especially for milk marketing: Growth of milk production requires efficient marketing of milk. Wherever marketing outlets were established to procure milk, dairy sector has witnessed impressive growth. Cooperatives have played a major role in this regard.
Investments in milk processing
Artificial insemination in cows
Absence of restrictive regulations on milk marketing & trade
Snapshot India's dairy sector
Dairy sector contributes one-fourth of total income generated in agriculture sector and this share has been rising. Thus, dairy & livestock sector has played a prominent role in growth of agriculture.
Per capita production of milk in India has now exceeded the recommended dietary allowance (RDA). RDA for milk is 377 grams per person per day for India, as recommended by the National Institute for Nutrition under ICMR.
India is the largest milk producing nation in the world with one-fourth of global production. Earlier, USA was the largest producer of milk in the world. However, share of India in world milk output has almost doubled in last 25 years.
Per capita absorption of milk and milk products has almost doubled during the last 20 years. This growth in the intake of milk and milk products implies that milk has made highest contribution to improve nutrition in India.
Growth of dairy sector has been pro-poor and pro-women besides being resilient. Growth of milk does not require particular endowments like irrigation, good soil etc.
Dairy sector has been growing despite input subsidies or output price support.
Much of the growth in milk output during the last 50 years is due to an increase in the population of dairy animals. Number of female bovines in India increased from 122.7 million in 1972 to 246.7 million in 2019 (doubling).
Challenges of Dairy Sector
Low productivity of milch animals:
According to FAO, milk yield of Indian cows is 2/3rd of World average and it is much less compared to milk yield in developed countries. World average milk yield per cow is 7.2 kg and in India it is 4.87 kg.
There is wide variation in milk yield across states. Milk yield of cows ranges from 1.49 kg in Assam to 13.31 kg in Punjab. Similarly, daily milk output per buffalo varies from low of 1.61 kg in Odisha to 9.63 kg in Haryana.
Increased emission of greenhouse gases by ruminants: Doubling population of female bovines means GHG emissions by dairy animals has doubled in the last 50 years.
Very low share of export: Success of white revolution has not translated into export of milk products from India. Dairy exports constitute only 2.6% of India's agri-exports which is much lower than 24% share of milk output in value of crop and livestock output. World dairy exports stood at US $63 billion in 2021 whereas India's dairy exports was only US$392 million (0.62% of world dairy exports).
High antibiotic usage in dairy sector: Chemicals are indiscriminately used in commercial dairy which adversely affects quality of livestock and milk. Urine and dung of animals with chemicals affects soil microbes and greenhouse gas emissions.
Way Forward
Increasing productivity of milch animals: There is a need to focus on increasing milk output per animal both on a national basis and on regional basis.
On the national level, increase in productivity needs breed improvement, improved breeding practices like Artificial Insemination, better feeding and better maintenance and health-care of livestock.
Regionally, the focus should be on states where per cow milk yield are low as compared to national average i.e., Assam, North-eastern states, Chhattisgarh, Jharkhand, Madhya Pradesh, Odisha & West Bengal.
Meeting consumer expectations: Dairy industry needs to evolve to meet consumer preferences for various types and traits of milk. Today, consumers in cities prefer fresh or unprocessed milk or cow milk. Dairy value chain should aim to meet such demand.
Promoting milk exports: As domestic milk production is already crossing recommended dietary allowance for milk and slowing down of population growth with milk production expected to grow by 6%, India is expected to see surplus milk production which can be channelised to some exports. However, dairy exports have seen a big increase in recent years. Milk & milk products has increased four times after 2017-18. Dairy export doubled in 2021-22 to reach Rs. 4742 crore and increased by 64 per cent in volume. Still exports are less than 0.5 percent of total domestic production of milk.
Steps to promote milk exports are:
Investments in milk value chain and tapping markets of high-end developed countries.
Milk as a solution for nutritional deficiency: Milk should be promoted as a critical input for addressing nutritional deficiency and improving health outcomes in India, especially in children & women. Income elasticity of demand for milk and dairy products is high.
Export competitiveness & FTAs involving milk: India’s domestic milk industry is opposed to FTAs that involves liberalisation of trade (import) in dairy products. If India wishes to capture overseas dairy markets than our milk industry needs to export competitive. Thus, India’s dairy industry needs to increase its competitiveness and confidently compete with imports and export markets.
Milk valued added products: Focusing on exports of milk value added and processed products rather than liquid milk alone.
Milk Quality: Compliances with high sanitary & phyto-sanitary standards of countries particularly in developed markets.
Livestock health: Steps to promote vaccination and disease free areas like foot mouth disease free areas, as some developed countries require this.
Adopting food systems approach: Integrated livestock and crop systems are organised in a complementary and in synergy. India’s agriculture is transitioning to natural & organic farming for this animal dung and urine are critical inputs. Using by-products from dairy to produce organic & bio-inputs is a win-win for both dairy and crop sector.
Dairy pricing: Currently, fat content in milk is the sole criteria for pricing of milk. There is a need to develop measurements and standards around other traits like solid-not-fats in milk.
Sustainability of dairy sector: There is a need to monitor the presence of antibiotics and other chemicals in milk and check it.
G20 Meetings of Agricultural Chief Scientists (MACS) 2023 in Varanasi under India's Presidency saw the launch of MAHARISHI Initiative.
About MAHARISHI
MAHARISHI stands for Millets And otHer Ancient Grains International Research Initiative.
MAHARISHI secretariat shall be housed at Indian Institute of Millets Research (IIMR), Hyderabad with technical support from ICRISAT, One CGIAR Centres and other International organisations.
Focus areas of MAHARISHI are:
Establish mechanisms to connect researchers and institutions working in identified grain crops to enhance the dissemination of research findings and identify research gaps and needs.
Establish web platforms to connect researchers, exchange data, share communication products and thematic briefs to encourage research & information sharing.
Organise capacity building activities and international workshops & conferences.
Performance identification and recognition to scientists.
Ministry of Agriculture & Farmers Welfare has launched SATHI Portal & Mobile App.
About SATHI Portal
SATHI stands for Seed Traceability, Authentication and Holistic Inventory.
SATHI is a centralised online system for seed traceability, authentication & inventory designed to deal with challenges of seed production, quality seed identification & seed certification.
This portal will ensure seed quality assurance and identify the source of seed in the seed production system.
SATHI portal will consist of integrated 7 verticals of seed chain: Research Organisations, Seed Certification, Seed Licensing, Seed Catalogue, Dealer to Farmer Sales, Farmer Registration and Seed DBT.
Seeds with valid certification can only be sold by valid licensed dealer to centrally registered farmers who will receive subsidy through DBT directly into their pre-validated bank accounts.
There will be QR code under this system, through which the seeds can be traced.
Need for SATHI Portal
Goods Quality Seeds are critical inputs for a robust agriculture. However, inferior quality or spurious seeds affects the agriculture sector output and causes loss to farmers.
It is expected that if farmers have access to newer and quality seeds having resistance against climate change and new types of pests, agricultural production can be increased by 20%.
Context: 12th session of AMIS Rapid Response Forum met in Chandigarh, India on the margins of 2nd meeting of G20 Agriculture Deputies in 2023.
About Agricultural Market Information System
AMIS is an inter-agency platform to enhance food market transparency and policy response for food security launched in 2011 by G20 Ministers of Agriculture following global food price hikes in 2007/08 and 2010.
By enhancing transparency and policy coordination in international commodity markets, AMIS has helped to prevent unexpected price hikes and strengthened global food security.
It brings together principal trading countries of agricultural commodities, it assesses global food supplies (focusing on wheat, maize, rice & soybeans) and provides a platform for constructive dialogue.
Membership: Composed of G20 members plus Spain and 7 additional major exporting & importing countries of AMIS crops, representing a large share of global food markets.
Structure of AMIS: AMIS consists of three main bodies:
Global Food Market Information Group: Composed of technical representatives from AMIS participants to collect market & policy information.
Rapid Response Forum (RRF): Assembles policymakers to promote early discussion about critical market conditions and ways to address them. In the event of market instability, RRF of AMIS coordinates appropriate policy measures.
Multiagency Secretariat: Currently, includes 11 international organisations and entities, produces short-term market outlooks, assessment and analyses, and supports all functions of the Information Group and the Rapid Response Forum.
Outputs of AMIS
Market Monitor: Assessing global market situation and outlook for AMIS crops.
Indicator Portal: Featuring key measures to identify critical market conditions that might require policy action.
Market Database: Providing latest forecasts on production, consumption, trade and stocks.
Policy Database: Compiling information on policies that might impact on global food markets.
Context: Recently the three-day international conference on ‘Blended Learning Ecosystem for Higher Education in Agriculture 2023’, which was jointly hosted by the Indian Council of Agricultural Research (ICAR) and the World Bank, has come out with a ‘Delhi declaration’.
What is the Delhi declaration?
The declaration stresses the need to strengthen digital infrastructure, including e-learning content, and deployment of emerging immersive technologies across agricultural higher education institutions in India.
It emphasizes creating a renewed and resilient system for the gender-inclusive and sustainable agriculture education sector.
Multidisciplinary technology-facilitated education should be promoted and the policies on science, technology, engineering, agriculture and mathematics (STEAM) in agricultural higher education need to be transformed, the declaration said.
Context: India has joined AIM for Climate Initiative.
About AIM for Climate
AIM for Climate stands for Agriculture Innovation Mission for Climate launched at COP 26 of UNFCCC at Glasgow.
It is a joint initiative of USA and UAE to address climate change and global hunger by uniting participants to significantly increase investment in and providing other support for climate smart agriculture and food systems innovation over five years (2021-2025).
Objectives of AIM for Climate
Demonstrate collective commitment to significantly increase investment in agricultural innovation for climate smart agriculture and food systems over five years (2021-25).
Support frameworks and structures to enable technical discussions and promotion of expertise, knowledge and priorities across international and national levels of innovation to amplify the impact of participants' investments.
Establish appropriate structures for exchanges between Ministers and chief scientists as key focal points and champions for cooperation on climate related agricultural innovation.
Innovation Sprints
An innovation sprint is an increase in aggregate self-financed investment from NGOs partners to achieve an outcome/output in agriculture innovation and for climate smart agriculture and food systems to be completed in an expedited timeframe.
Focus areas of AIM for Climate Innovation sprints are: (i) Smallholder Farmers in Low & Middle Income Countries (ii) Methane Reduction (iii) Emerging Technologies (iv) Agroecological Research.
Members of AIM for Climate
There are three avenues for participation in AIM for Climate coalition.
Government partner: Governments who announce an increase in aggregate public investment in agricultural innovation for climate smart agriculture and food systems over the next 5 years. 45 countries have joined as Government partners. India is also a government partner in this initiative.
Innovation sprint partner: Non-government participants who announce an increase in aggregate self-financed investment in agricultural innovation for climate-smart agriculture and food systems over the next five years (2021-2025) to enable investment for bold ideas to foster innovation in an expedited timeframe.
Knowledge partner: They are non-government participants who intend to participate in activities of AIM for Climate and announce to amplify agricultural innovation through: insight sharing, innovation collaboration, coordination, demonstration and deployment etc.
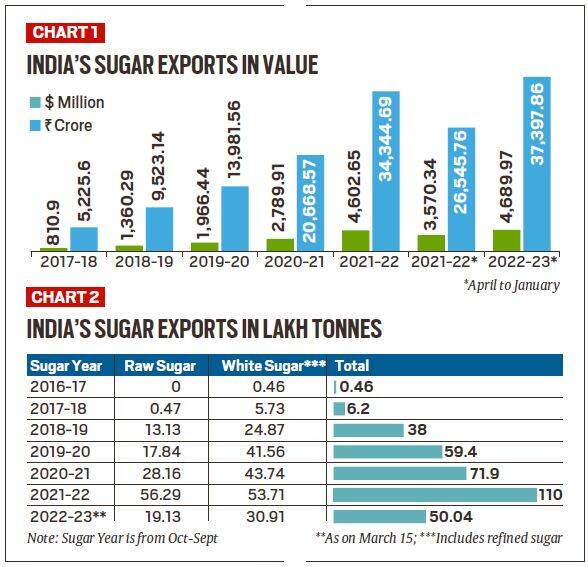
Between 2017-18 and 2021-22, sugar exports have soared from $810.9 million to $4.6 billion, and could cross $5.5 billion - or Rs 45,000 crore - in the fiscal year 2022-23.
The increase is even more significant in quantity terms. During the 2016-17 and 2017-18 sugar years (Oct-Sept), India’s shipments were a mere 0.46 lakh tonnes (lt) and 6.2 lt respectively, which zoomed to 110 lt by 2021-22.
Chart below shows the value of sugar exports from India in US Dollars and Rupees (2017-18 to 2022-23), increasing year-on-year except in the 2021-22 period.
India’s exports of both raw and white sugar. Chart below shows the quantity in lakh tonnes from 2016-17 to 2022-23. Till 2017-18, India hardly exported any raw sugar.
The efforts to push exports of raws got a further boost when Indonesia, in December 2019, agreed to tweak its ICUMSA norms to enable imports from India.
The Southeast Asian nation previously imported only raw sugar of 1,200 ICUMSA or more, largely from Thailand. Those levels were brought down to 600-1,200 to allow its refiners to process higher purity raws from India.
Out of India’s total 110 lt sugar exports in 2021-22, raws alone accounted for 56.29 lt. The biggest importers of Indian raw sugar were Indonesia (16.73 lt), Bangladesh (12.10 lt), Saudi Arabia (6.83 lt), Iraq (4.78 lt) and Malaysia (4.15 lt).
The country also exported 53.71 lt of white/ refined sugar, the leading destinations for which included Afghanistan (7.54 lt), Somalia (5.17 lt), Djibouti (4.90 lt), Sri Lanka (4.27 lt), China (2.58 lt), and Sudan (1.08 lt).
What are Raw and White Sugar:
ICUMSA (short for the International Commission for Uniform Methods of Sugar Analysis), is a measure of the purity of sugar based on colour. The lower the value, the more the whiteness.
Raw sugar is what mills produce after the first crystallisation of juice obtained from crushing of cane. This sugar is rough and brownish in colour, with an ICUMSA value of 600-1,200 or higher.
Raw sugar is processed in refineries for removal of impurities and decolourisation. The end product is refined white cane sugar having a standard ICUMSA value of 45. The sugar used by industries such as pharmaceuticals has ICUMSA of less than 20.
Till 2017-18, India mainly shipped plantation white sugar with 100-150 ICUMSA value. This was referred to as low-quality whites (LQW) in international markets.
Why are Raw Sugar Exports preferable?
Ease of Transport and Distribution: Much of the world sugar trade is in ‘raws’ that are transported vessels of 40,000-70,000 tonnes capacity as it requires no bagging or containerisation and can be loaded in bulk. The buyer of raw sugar is the refiner. Whereas, ‘Whites’ are usually packed in 50-kg polypropylene bags and shipped in 12,500-27,000-tonne container cargoes over shorter distances. The buyer of white sugar is the end-consumer.
Time Window: The refineries in countries such as Indonesia, Malaysia, South Korea, China and Bangladesh imported raws from Brazil. Brazilian mills operate from April to November, whereas our crushing is from October to April. We told them that they could source our raws during Brazil’s off-season.
Freight Cost Savings: The voyage time from Kandla, Mundra or JNPT to Ciwandan Port of Indonesia is 13-15 days, compared to 43-45 days from Brazil’s Port of Santos.
Specific advantages of Indian raw sugar:
Dextran free raw sugar: Dextran is a bacterial compound formed when sugarcane stays in the sun for too long after harvesting. Indian raw is produced from fresh cane crushed within 12-24 hours of harvesting. The cut-to-crush time is 48 hours or more in Brazil.
Supply of raw sugar with a very high polarisation of 98.5-99.5%: Polarisation is the percentage of sucrose present in a raw sugar mass. The more the polarisation — it is only 96-98.5% in raws from Brazil, Thailand and Australia — the easier and cheaper it is to refine.
Enhanced awareness about the quality of Indian raw sugar: enables our raws today fetch a 4% premium over the global benchmark (New York No. 11 futures contract) price. This is in contrast to white sugar as our LQW sells at a $40/tonne discount to the world price (London No. 5 futures).
Challenges:
Dwindling availability for domestic market: Year-end stocks of sugar with Indian mills peaked at 143 lt in 2018-19. The concerted export drive, coupled with diversion of sugarcane juice to produce ethanol for blending with petrol, helped bring down closing stocks to about 70 lt by 2021-22 which was enough for just over 3 months of domestic consumption. This is in contrast to 2017-18, where closing stocks of sugar at 105 lt enabled stocks accumulation to 5 months of domestic consumption.
Caps on Exports: Lower stocks and production dipping to an estimated 334 lt (from 359.25 lt in 2021-22) has led the government to cap India’s exports in the current sugar year to 61 lt. Out of that, over 50 lt have already been dispatched.
Reduced price realisation of sugar farmers: Mills in Maharashtra are now realising around Rs 32 for every kg of sugar sold in the domestic market. As against this, London white sugar prices are ruling at $585 per tonne. Even after factoring in the $40/tonne LQW discount and deducting Rs 2,500-3,000/tonne of internal transport and port expenses, the ex-mill realisations from exports work out much higher, at Rs 42-42.5/kg.
Way Forward:
The government may be concerned about domestic availability and food inflation. But overseas markets lost aren’t easy to regain.
Building export markets takes effort. Overseas buyers need to be convinced about the price competitiveness, product quality, and reliability of supplies from the exporting country.