Climate Change

SC modifies order on Ecologically Sensitive Zones around protected forests 

Context: The Supreme Court modified its judgment to have mandatory Eco sensitive zones (ESZ) of a minimum one kilometre around protected forests, national parks and wildlife sanctuaries across the country.

What is the concept of Ecologically sensitive zone (ESZ)?

  • The 2002 Wildlife Conservation Strategy envisaged lands within 10 km of the boundaries of national parks and wildlife sanctuaries to be notified as ecologically fragile zones under Section 3(2)(v) of the Environment Protection Act 1986.
  • Ecologically sensitive zones (ESZ) are intended to protect ‘protected areas’ – national parks and wildlife sanctuaries – by transitioning from an area of lower protection to an area of higher protection. 
  • ESZs are effectively insulating layers where humans and nature can be at peace with each other.
  • Thus they act as a buffer and ‘shock absorber’ to the protected areas.
  • Besides, in order to protect the biodiversity in areas having ecological significance, Ministry also notifies Ecologically Sensitive Areas (ESA), which has unique biological resources, which require special attention for their conservation.
  • The MoEFCC was to take steps to protect the environment by regulating and (if required) prohibiting industries, operations and processes. 

What is the procedure to notify ESZ?

  • Survey and identification of ESZs are conducted by the respective State Governments for consideration of the Central Government as per the guidelines formulated by the Ministry of Environment, Forest and Climate Change (MoEF&CC). 
  • On the basis of proposals and recommendations of the State Government, Ministry notifies the ESZs under the Environment (Protection) Act, 1986. 
  • Section ‘3’ of the ESZ Notification provides the Guidelines for preparation of the Zonal Master Plan (ZMP) by the respective State Government and mandates preparation of the Tourism Master Plan forming part of Zonal Master Plan on the basis of the Carrying Capacity study of the concerned ESZ. 

Evolution of the ESZ in India:

  • 2002 - Wildlife Conservation Strategy envisaged lands within 10 km of the boundaries of national parks and wildlife sanctuaries to be notified as ecologically fragile zones under Section 3(2)(v) of the Environment Protection Act 1986 .
  • 2005 - National Board for Wildlife decided to delineate site-specific ESZs to regulate specific activities instead of prohibiting them. So it asked the States and UTs to propose ESZs. 
  • 2006 - Supreme Court directed the MoEFCC to have the States’ and UTs’ proposals submitted within four weeks.
  • 2010 – No guidelines by MoEFCC. Supreme court intervened. 
  • 2011 – Guidelines by MoEFCC came:
    • A committee consisting of the Wildlife Warden, an ecologist, and an official from the local government was to determine the extent of each ESZ, the nature of environmental concerns to be addressed and ways to address them
    • The Chief Wildlife Warden was to then list the activities that were to be prohibited, to be restricted with safeguards and to be permitted.
    • Finally, the state government would submit this, the geographical description of the area and the biodiversity values, the rights and entitlements of local communities, and their economic potential and implications for their livelihoods, as a proposal to the MoEFCC for notification.
    • To monitor compliance with the various provisions of each notification, a State had to set up a monitoring committee for each ESZ; headed by the District Collector as the chairperson.
  • 2012 – ESZ notification began.

What was the recent Supreme court order?

  • The court said that the MoEFCC guidelines are also to be implemented in the area proposed in the draft notification awaiting finalisation and within a 10-km radius of yet-to-be-proposed protected areas. 
  • It mandated a minimum 1-km eco-sensitive zone around national parks or wildlife sanctuaries
  • The Court also allowed States to increase or decrease the minimum width of ESZs in the public interest.
  • Court vested the powers to ensure compliance with the guidelines with the Principal Chief Conservator of Forests (PCCF) and the Home Secretary of the State/UT.
  • The court also ordered that no new permanent structure could come up for any purpose within an ESZ.
  • All the activities permitted by the guidelines and which are already being carried out can continue only if the PCCF grants permission, and that too within six months of the court’s order. This period has already expired.

What is the issue now?

  • These court’s directions have put the lives of many people in the hands of the PCCF. Several concerns were sparked regarding the habitation falling under the ESZ zone. There rights are also protected under Forest rights act 2006 and PESA act 1996.
  • If no permanent construction is to be permitted for any purpose, a villager who is desirous to reconstruct his house would not be permitted.
  • Similarly, if the government decides to construct schools, dispensaries, anganwadi and other basic structures for improvement of the life of the villagers, the same would also not be permitted.”

What is the modified order?

  • 2022 order will not be applicable to ESZs in respect to which draft and final notifications have been issued by the MoEFCC, and where proposals for such notifications have been received by the ministry.
  • It will also not be applicable where the national parks and sanctuaries are located on inter-state borders or share common boundaries.
  • But it underlined that no mining would be allowed, either within national parks and sanctuaries or in a 1-km radius.

The distribution and utilisation of water bodies in India

Context: A report released by Ministry of Jal Shakti has thrown light on the number of water bodies in India and what they are used for. The document is the first such census of water bodies in India. The census has identified 24,24,540 water bodies in India.

Definition of a Water body 

  • All natural or man-made units bounded on all sides with some or no masonry work used for storing water for irrigation or other purposes (e.g. industrial, pisciculture, domestic/drinking, recreation, religious, ground water recharge etc.) will be treated as water bodies in this Census. These are usually of various types known by different names like tank, reservoirs, ponds and bundhies etc. 
  • A structure where water from ice-melt, streams, springs, rain or drainage of water from residential or other areas is accumulated or water is stored by diversion from a stream, nala or river will also be treated as water body.

Information available on water bodies through following initiatives / Institutions

  • India - Water resource information system (India-WRIS) -  Central Water Commission (CWC), Ministry of Jal Shakti.
  • Repair, Renovation and Restoration (RRR) of water bodies - Component of Pradhan Mantri Krishi Sinchayee Yojana (Har Khet Ko Pani) 
  • “Jal Shakti Abhiyan -  “Catch the Rain” The “Jal Shakti Abhiyan 
  • Central Pollution Control Board (CPCB) CPCB 
  • Mahatma Gandhi National Rural Employment Guarantee Scheme (MGNREGS) 

Salient Features

  • First census of water bodies was conducted with reference year 2017-18 across the country in 33 States/UTs except Daman & Diu, Dadra & Nagar Haveli and Lakshadweep.

Classifications

  • During 1st census of water bodies, 24,24,540 water bodies have been enumerated in the country, out of which 
  • 59.5% (14,42,993) are ponds
  • 15.7% (3,81,805) are tanks
  • 12.1% (2,92,280) are reservoirs 
  • remaining 12.7% (3,07,462) are water conservation schemes/check dams/percolation tanks, lakes and other water bodies
image 88

Location / Concentrations

  • Top five States in number of water bodies are as follows
image 90
image 96
  • Top five states in number of Ponds, Tanks and Lakes are as follows
image 94
  • Top five states in number of Reservoir, Water Conservation schemes are as follows
image 89
  • Out of the enumerated 24,24,540 water bodies, 97.1% (23,55,055) are in rural areas while 2.9% (69,485) are in urban areas. 
  • Among all water bodies, 9.6% are located in Tribal areas, 8.8% in Flood prone areas,7.2 % under Drought Prone Area Programme (DPAP), 2.0 % in Naxal affected areas , 0.7% under Desert Development Programme (DDP)and remaining 71.7% water bodies are located in other areas.
image 92

Operational Status 

  • Among these water bodies, 83.7% (20,30,040) are 'in use' whereas the remaining 16.3% (3,94,500) are not in use/non-functional on account of drying up, construction, siltation, destroyed beyond repair, salinity, industrial effluents etc. 

Uses

  • Out of all 'in use' water bodies, major water bodies are reported to be used in Pisciculture followed by Irrigation and Ground water recharge.
image 93

Ownership 

  • 55.2% (13,38,735) water bodies are owned by private entities whereas 44.8% (10,85,805) are under public ownership.
image 95

Man made & Natural water bodies

  • 78% are man-made water bodies whereas 22% are natural water bodies. Majority of man-made water bodies are earthen in nature and have original cost of construction upto Rs. 1,00,000. 
image 91

Encroachment

• Among all 24,24,540 water bodies, 1.6% (38,496) water bodies are reported to be encroached. Majority of encroached water bodies are ponds followed by tanks. 

• Water User Associations (WUA) has helped to a large extent in preventing encroachments .

Need for Water Bodies Census

  • The need for conducting a separate census of water bodies was pointed out by the Parliamentary Standing Committee on Water Resources on the subject “Repair, Renovation and Restoration of Water Bodies – Encroachment on water bodies and steps required to remove the encroachment and restore the water bodies”. 
  • The Committee recommended that in order to enable an objective assessment of water bodies and their condition, there should be separate census of water bodies and thereby creating a Central database on water bodies. As recommended by the Standing Committee, the first Census of Water bodies was launched by Department of Water Resources, River Development & Ganga Rejuvenation in 2018-19 in convergence with the 6th Minor Irrigation (MI) census.

 The use of water bodies data is also envisaged in the following fields:

  • The water bodies census data will serve as an authentic dataset for estimation of recharge of ground water.
  •  Information obtained from MI Census and water body census will be highly useful in

implementation of the Atal Bhujal Yojana. 

  • Block/ Gram Panchayat level data related to MI structures & water bodies will help the scheme personnel to convince the community of the actual groundwater conditions at the local level.
  •  The information can be used for spatial analysis of distribution of abstraction structures Coordinates (Longitude and Latitude) and assessment of ground water draft.
  • There are several instances of water from bore wells being sold and bought at farm level, but specific reports are not available. The census may provide an opportunity to get ground information on this aspect and provide insights into farm level water trading. The information will be relevant to State Governments involved in farm level irrigation and water management.
  • Results of First Census of Water bodies will be immensely useful for planning and executing Pradhan Mantri Matsya Sampada Yojana (PMMSY).

The Department of Water Resources, River Development and Ganga Rejuvenation (DoWR, RD & GR), Ministry of Jal Shakti (MoJS), Government of India (GoI) has been conducting census of minor irrigation structures, quinquennially under the Centrally Sponsored Scheme “Irrigation Census” with 100% central assistance to States/UTs. The scope of Irrigation Census Scheme has been enhanced by launching the Census of Water Bodies in convergence with sixth Minor Irrigation Census which covers all types of water bodies in both rural and urban areas and aims to collect all the important parameters of the Water Body like type of use, status (whether defunct or in-use), storage etc.

The threat of rising sea levels

Context: The World Meteorological Organisation (WMO) has found in a new report, entitled ‘State of the Global Climate 2022’, that the world’s sea level is rising at an unprecedented rate.

What is average sea level?

  • It is the position of the air-sea interface, to which all terrestrial elevations and submarine depths are referred. 
  • The sea level constantly changes at every locality with the changes in tides, atmospheric pressure, and wind conditions. 
  • Longer-term changes in sea level are influenced by Earth’s changing climates.
  • Consequently, the level is better defined as mean sea level, the height of the sea surface averaged over all stages of the tide over a long period of time.

How sea levels are changing now?

  • According to the WMO report, the sea level has been rising in the three decades for which satellite altimeter data is available (1993-2022). But, while the rate of sealevel rise was 2.27 mm/year in 1993-2002, it shot up to 4.62 mm/year in 2013-2022.
  • Long-term changes in global mean sea level (GMSL) are predominantly driven by three processes:
    • Ice Melt: Due to the warming atmosphere and ocean, ice sheets and mountain glaciers are melting, resulting in the addition of fresh water into the ocean.
    • Thermal Expansion: Ocean water expands as it absorbs trapped heat, causing sea levels to rise. As increasing concentrations of carbon dioxide and other greenhouse gases drive global warming, 90% of the ‘extra’ heat is stored in the oceans. This leads to ocean warming. And as the ocean heats up, it undergoes thermal expansion, which in turn leads to a rise in the GSML
    • Land Water Storage: Water that is either removed from land (through groundwater pumping, for example) or impounded on land (through dam building, for example) can cause a net change in the total water found in the ocean.
  • According to the report, in 2005-2019, loss of glaciers and ice sheets contributed 36% to the GSML rise. Ocean warming — the phenomenon of rising mean ocean temperatures — contributed 55%, and changes in the storage of land water contributed less than 10%.
image 87
State of Global Climate report 2022:

The WMO State of the Global Climate report 2022 focuses on key climate indicators – greenhouse gases, temperatures, sea level rise, ocean heat and acidification, sea ice and glaciers. It also highlights the impacts of climate change and extreme weather.

Drought, floods and heatwaves affect large parts of the world and the costs are rising

Global mean temperatures for the past 8 years have been the highest on record

Sea level and ocean heat are at record levels – and this trend will continue for many centuries

Antarctic sea ice falls to lowest extent on recordEurope shatters records for glacier melt
General factors behind sea-level changes:

Short-term Effects:
Variations of sea level on periods ranging from minutes to weeks that arise from processes like storm surge, wave runup, wave setup, astronomical tides and freshwater input.

Variability in Ocean circulation: This includes large-scale climate signals like the seasonal cycle, El Niño-Southern Oscillation, North Atlantic Oscillation, and Pacific Decadal Oscillation. This also includes longer-term changes in ocean circulation that may occur in the future and global sea level rise associated with long-term warming of the ocean and associated expansion.

Glaciers: Glaciers outside of the ice sheets account for about 1% of total ice trapped on land. These changes are expressed regionally through gravitational, rotational and deformational (GRD) changes that have a characteristic pattern, or fingerprint.

Land Water Storage: Changes associated with the transfer of water between land and ocean. This includes variability in the global water cycle, groundwater withdrawal, and water impoundment.

Ice Sheet: The Greenland and Antarctic ice sheets contribute to global sea level rise.

Subsidence: Movement of the land at the coast (could also be uplift) in response to a range of physical processes including groundwater and hydrocarbon withdrawal, tectonics, and glacial isostatic adjustment. These changes can vary widely in both time and space and can be associated with human activities.

What can be the possible impacts of Sea level rise?

  • Changes in land – ocean configuration which in turn can alter the heat absorption rates.
  • Reduced land for human activities - as rising seas swallow more of the land cover, particularly in coastal areas, coastal communities will face an “acute shortage of land for human use”
  • Increase in cyclones - As the GSML continues to rise, along with a rise in ocean temperatures, the chances of cyclones could increase, affecting coastal communities and leading to large economic liabilities for tropical countries such as India and South Africa, which have high population densities.
  • Increase in salinity - more sea water could seep into the ground, leading to the groundwater — which is usually freshwater — turning more and more saline. 
  • All these factors will affect the agriculture, infrastructure and Settlements.

Abatement Cost

Context: 'Abatement cost' has emerged as a key tool to steer the decarbonisation of the economy, to reduce its cost and to assess the efficiency of a technology, an investment or a public policy.

Abatement Cost

  • Abatement cost is simply the cost of an intervention that will reduce greenhouse gases emissions by one tonne. Abatement costs will be negative for energy efficient (cost savings) technologies.
  • Example: A plant can reduce its greenhouse gas emissions by replacing a gas boiler with a heat pump. But they will have to pay for installation of heat pump and will have to pay for the electricity needed to run it and will save money by no longer purchasing gas. Abatement cost per tonne of carbon not emitted can be arrived at dividing the total additional cost by the avoided emissions. 

Significance of Abatement Cost

  • Abatement costs can be considered as a tool to select priority climate actions. 
  • Negative abatement costs correspond to opportunities to reduce emissions with a net economic gain. Lowest abatement costs indicate opportunities to avoid emissions at low cost.
  • Thus, if we have limited budget for transition, then choosing the lowest abatement costs will maximise emissions reductions.

Limitations of using Abatement Cost

  • Abatement cost focuses on marginal emissions: Abatement cost is designed to reduce marginal emissions. Thus, if the goal was to reduce emissions slightly - for ex. by 10%, they abatement cost will be perfect tool. But the world is aiming for 'Net-zero emissions', wherein we cannot ignore hard-to-abate emissions. 
  • Costs of technologies keep evolving: In a deep transition, technologies and their costs are not fixed and they evolve with our investments. For ex. In 2007, solar photovoltaics and wind power were expensive per tonne avoided. However, with increasing investments the cost of solar and wind power has come down. 

Conclusion

Thus, marginal abatement costs may not be useful in developing a decarbonisation strategy. However, to minimize costs to net-zero emissions, we need to implement integrated strategies – in all sectors simultaneously – an economic, technological and social transition towards carbon neutrality.

Framework for acceptance of Green Deposits

Context: Climate change has been recognised as one of the most critical challenges faced by the global society and economy in the 21st century. The financial sector can play a pivotal role in mobilizing resources and their allocation thereof in green activities/projects. Green finance is also progressively gaining traction in India. Deposits constitute a major source for mobilizing of funds by the banks and some financial intermediaries are already offering green deposits for financing green activities and projects. With a view to fostering and developing green finance ecosystem in the country further, it has been decided to put in place a Framework for acceptance of Green Deposits by the banks.

What are Green Deposits?

  • A green deposit is a fixed-term deposit for investors looking to invest their surplus cash reserves in environmentally friendly projects. Green bonds used to be the most common fixed-income ESG product in India earlier, and now products like green deposits are gaining significance.
  • Corporates looking for inclusion of a sustainability agenda into their treasury activities or those that have limited opportunities for investment in environmentally beneficial projects can invest in these green deposits.

Purpose of the framework:

To encourage banks to offer green deposits to customers, protect interest of the depositors, aid customers to achieve their sustainability agenda, address greenwashing concerns and help augment the flow of credit to green activities/projects.

Key Guidelines:

  • Applicability: The provisions of these instructions shall be applicable to Scheduled commercial banks (excluding payment banks, RRBs), deposit taking NBFCs and Housing finance companies (HFCs)
  • The Banks shall issue green deposits as cumulative/non-cumulative deposits. On maturity, the green deposits would be renewed or withdrawn at the option of the depositor. The green deposits shall be denominated in Indian Rupees only.
  • The eligible banks shall put in place a comprehensive Board-approved policy on green deposits covering all aspects in detail for the issuance and allocation of green deposits.
  • Allocation of funds: The proceeds raised form the green deposits shall be allocated to the following activities

Projects involving nuclear power generation, generating energy from biomass and hydropower plants larger than 25MW are excluded from eligible projetcs. 

The banks shall ensure that the funds raised through green deposits are allocated to the eligible green activities/projects.

  • Third party verification: Allocation of funds raised through green deposits shall be subject to an independent Third-Party Verification/Assurance which shall be done on an annual basis. The third-party assessment would not absolve the bank of its responsibility regarding the end-use of funds.
  • A review report shall be published by the banks covering the details about amount raised under green deposits, amount of funding to the eligible green projects and third-party verification report. 

What is a normal Monsoon and what factors lead to the weakening of the Monsoon?

Context: According to the private weather forecasting agency Skymet, India is likely to get "below normal" monsoon rains in 2023 with an increased likelihood of El Nino, which typically brings dry weather to Asia.

About Normal Monsoon

  • The IMD predicts a “normal”, “below normal”, or “above normal” monsoon in relation to a benchmark “long period average” (LPA). 
  • According to the IMD, the “LPA of rainfall is the rainfall recorded over a particular region for a given interval (like month or season) average over a long period like 30 years, 50 years, etc”.
  • The IMD’s prediction of a normal monsoon was based on the LPA of the 1971-2020 period, during which India received 87 cm of rain for the entire country on average.
  • The IMD maintains five rainfall distribution categories on an all-India scale. These are:
    • * Normal or near normal, when the percentage departure of actual rainfall is +/-10% of LPA, that is, between 96-104% of LPA;
    • * Below normal, when departure of actual rainfall is less than 10% of LPA, that is 90-96% of LPA;
    • * Above normal, when actual rainfall is 104-110% of LPA;
    • * Deficient, when departure of actual rainfall is less than 90% of LPA; and
    • * Excess, when the departure of actual rainfall is more than 110% of LPA.

Factors which affect the Monsoon

El Niño

  • The warming in the tropical Pacific Ocean because of El Niño weakens the southeast trade winds flowing to the intertropical convergence zone over India
  • Since these winds are the main driving force of the Indian summer monsoon, El Niño events are associated with weak monsoons and lower than average rainfall. 
  • The location of the El Niño event also influences its effects on the Indian monsoon – warming in the central Pacific Ocean affects the Indian monsoon more than if the warming is in the eastern Pacific Ocean.
q9QnrlWb9AjHGM7EROhAuTGem7LtNDVd5rK6 GdInuqmddJ3yfrYA1Kp1 AXBvatwL7zcKFfSIMkkUVq7 Uk6BjrtHqaeB14ey9C3

La Niña

  • The La Niña has the opposite effect to the El Niño and is responsible for stronger monsoons and above-average rainfall.
  • Equatorial Indian Ocean Oscillation (EQUINOO): 
  • It is thought to arise as an effect of the Indian Ocean Dipole(IOD) and refers to increased and decreased cloud formation between the western and eastern equatorial Indian Ocean. 

Although the IOD was discovered only in 1999, and the EQUINOO in 2002, both have been recognised as important modulators of the Indian summer monsoon. Positive Indian Ocean Dipole(IOD) and EQUINOO events are associated with more rainfall as these events increase moisture transport from the southeastern parts of the Indian Ocean.

Indian Ocean Dipole(IOD):

  • IOD measures differences in sea surface temperatures between the western and eastern parts of the Indian Ocean.
  • Indian Ocean Dipole (IOD) is basically similar to the El Nino weather system that develops in the Pacific Ocean. It is characterized by an irregular oscillation of sea-surface temperatures in the eastern and western Indian Ocean

Atlantic sea surface temperature(SST) variability

  • The Atlantic SST variability affects the Indian summer monsoon in the same way that the ENSO does. 
  • A warming of the surface of the Atlantic Ocean weakens the monsoon, just as cooling of the ocean’s surface has the opposite effect. 
  • The effects of this phenomenon, also known as the Atlantic Niño on the Indian summer monsoon is thought to be mediated through perturbations in the jet streams above India.

Mascarene High

  • The Mascarene High is a semi-permanent high-pressure zone in the south Indian Ocean, about 4,000 km from India, near the Mascarene Islands. 
  • The Mascarene High begins developing in mid-April and is a major factor in driving the circulation between the northern and southern hemispheres that powers the summer monsoon winds towards the Indian subcontinent from the Indian Ocean.
BnZZdgipJGG2 eilbUPJ9ODbJ3i2sKW3sdBK XiI7RPLf7Xt11MeDnpsb2GXm76eBzZarC9YH8omiYpni3zBZ32jDx6J0RigFid73TYqESxQUZYwdB3EsaaT01kpfhgCXOveryjSN SeFK9OLdIi2Q

Irrigation

  • One of the rather surprising local factors that affects the Indian monsoon, is irrigation. 
  • According to a 2019 study in the journal Climate Dynamics, the trend of decreasing rainfall over the Indo-Gangetic plains could be due to the extensive irrigation in this area. 
  • This is likely because irrigation affects soil moisture levels and temperature simultaneously, which affects atmospheric stability. Since the irrigation is over vast tracts of land, these changes shift the moisture convergence zone to the south, during the active phase of the monsoon.
  • The study finds that winter irrigation (November-March) actually strengthens the monsoon rains over the region for the following year and also reduces intra-seasonal variations in rainfall. 
  • However, with year-round irrigation, there is a noticeable decrease in the summer monsoon rainfall (June-September).

Aerosols and dust

  • Aerosols and dust are other local factors that have been shown to affect the monsoon rainfall in India. 
  • In a recent study in 2022, researchers at IIT Bhubaneswar have shown that dust transported to the Arabian sea from the Middle-Eastern deserts (the Sahara and the Sinai) could increase rainfall in India and south Asia over short time scales of one or two weeks. 
  • In a similar study in 2014, scientists showed that dust aerosols likely heat up the atmosphere over north Africa and west Asia, which increases the flow of moisture over India. This results in rainfall, usually within a week of the event, over central India.

Monsoon Impact

  • The monsoon is critical for a healthy rural economy as 51% of the country’s farmed area, accounting for 40% of production, is rain-fed, according to the agriculture ministry
  • As much as 47% of the country’s population is dependent on agriculture, one of the mainstays of India’s economy, for livelihood, according to Economic Survey 2022-23.
  • It spurs farm produce and improves rural spending besides impacting inflation, jobs, and industrial demand, for ex. Good farm output keeps food inflation under check and ample harvests raise rural incomes and help inject demand into the economy.

El Nino and the monsoon

La Niña: 

  • La Niña basically refers to an abnormal cooling of the central and eastern Pacific Ocean waters off the coasts of Ecuador and Peru. 
  • Such cooling (sea surface temperatures i.e. SSTs falling) is a result of strong trade winds blowing west along the equator, taking warm water from South America towards Asia
  • The warming of the western equatorial Pacific, then, leads to increased evaporation and concentrated cloud-formation activity around that region, whose effects may spread to India as well.

Latest La Nina event:

  • The latest La Nina event was one of the longest ever, lasting from July-September 2020 to December-February 2022-23. And it brought copious rains to India – just as two previous “strong” La Nina in 2007-08 and 2010-11, followed by one “moderate” episode in 2011-12, had done.

El Niño:

  • It is a climate pattern that describes the unusual warming of surface waters in the eastern tropical Pacific Ocean. 
  • El Niño is the “warm phase” of a larger phenomenon called the El Niño-Southern Oscillation (ENSO). La Niña, the “cool phase” of ENSO, is a pattern that describes the unusual cooling of the region’s surface waters. El Niño and La Niña are considered the ocean part of ENSO, while the Southern Oscillation is its atmospheric changes.
  • During El Niño, the trade winds weaken or even reverse: 
  • Instead of blowing from east (South America) to west (Indonesia), they could turn into westerlies. 
  • As the winds blow from the west to east, they cause the masses of warm water to move into the central and eastern equatorial Pacific Ocean
  • The rise in SSTs there, thus, produces increased rainfall along western Latin America, the Caribbean and US Gulf Coast, while depriving Southeast Asia, Australia and India of convective currents.
  • El Niño occurs simultaneously with the Southern Oscillation. The Southern Oscillation is a change in air pressure over the tropical Pacific Ocean. When coastal waters become warmer in the eastern tropical Pacific (El Niño), the atmospheric pressure above the ocean decreases.
  • An El Niño event can be identified by the variations in sea surface temperature (SST) over the equatorial Central Pacific (the Nino 3.4 region). 
  • El Niño events are classified as weak, moderate, strong, and very strong depending on the strength of the positive SST variations. 
  • An El Niño event is announced when monthly Nino 3.4 SST deviations reach +0.50 °C, along with consistent atmospheric features, and when these anomalies persist for three consecutive months.

HkPn2lpoYMgZO2QpDB28Jctf3N2zZikeF76CuB2 pLzPE 01mm6Tkr9VDqlDXiS93jlBHm1dpLqTLBfVGuCi6NkbHOLJZFsBBBwO Iu4Q6vjexSPbjMLgOfVNYq0m7XqVyI3xDaB

Impact on Indian Monsoon:

  • El Nino may result in a weakening of the Indian monsoon, leading to drier conditions and reduced rainfall. 
  • On the other hand, La Niña events, which bring cooling to the Pacific Ocean, can result in stronger monsoons and more precipitation in India.

El Niño years and its trends in India

  • According to statistics, about 60 per cent of the time there will be a probability of drought in India during an El Niño year.
  • Chances of below-normal rain will be 30 per cent, while the prospect of normal rain remains very rare at 10 per cent.
  • However, El Niño conditions have been known to be unpredictable as well. For instance, even the strongest El Niño has given normal Monsoon rains of 102 per cent in 1997, while weak El Niño conditions resulted in severe drought in 2004 to the tune of 86 per cent.
  • Drought years:
  • Statistics from the year 2000 till 2019 show that there have been four instances of drought years. 
El nino
  • In 2002 and 2009, the countrywide deficiency was 19 per cent and 22 per cent, respectively, which were considered severe drought years. 
  • While in 2004 and 2015 the deficiency stood at 14 per cent each, which was again a drought.
  • Surplus: 
  • There has been only one instance in the last 25 years, since 1997, when the country saw surplus rain of 2 per cent despite El Niño.
  • Recent research indicates that the frequency of extreme El Niño events increases linearly with the global mean temperature, and that the number of such events might double (one event every 10 years) under 1.5°C of global warming. 
  • This pattern is projected to persist for a century after stabilisation at 1.5°C, indicating continuing high risks.
  • Changes to the frequency of extreme El Niño and La Niña events may also increase the frequency of droughts and floods in South Pacific islands.

Carbon Capture, Utilisation & Storage (CCUS)

They are a group of technologies for capturing of CO2 from large and stationary CO2 emitting sources, such as fossil fuel-based powerplants and other industries. CCUS also involves the transport of the captured CO2 to sites, either for utilisation in different applications or injection into geological formations or depleted Oil & Gas fields for permanent storage and trapping of CO2.

Neef for Carbon Capture (CCUS) Technologies

  1. Necessary to decarbonise hard to electrify sectors: CCUS offers only known technology for decarbonising the hard to electrify and CO2 intensive sectors such as steel, cement, oil & gas, petrochemicals & chemicals and fertilisers.
  2. Hydrogen economy: CCUS is expected to play a critical role in enabling hydrogen economy through production of blue hydrogen (i.e., coal gasification based hydrogen production with CCUS) based on India’s rich coal endowments.
  3. Sustenance of existing emitters: Nearly two-thirds of India’s 144 mtpa crude steel capacity and 210 GW of coal-based power capacity have an age of less than 15 years and cannot be wished away or stranded and need to be made sustainable by retrofitting with CO2 capture and disposition infrastructure. 

Carbon Capture Technologies

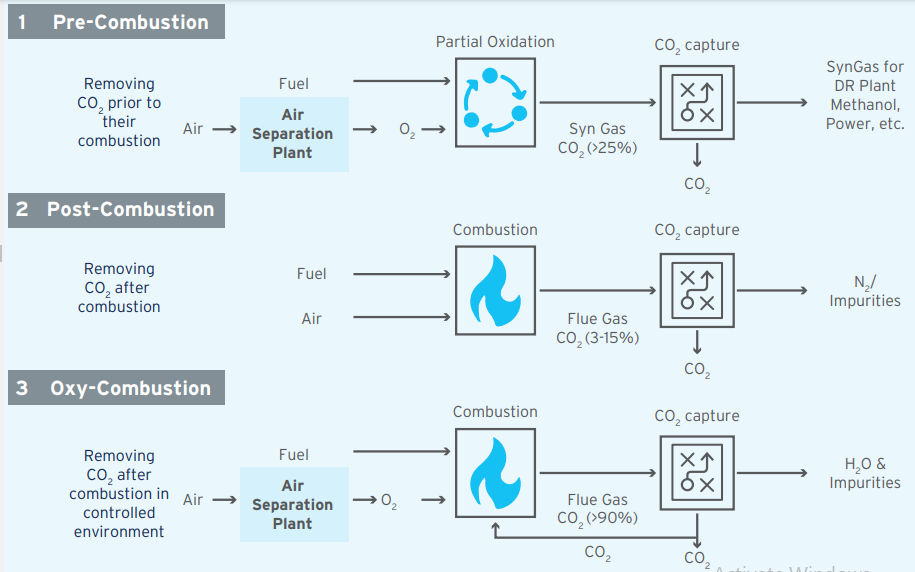
There are three broad categories of technologies for Capturing CO2:

  1. Post-combustion technologies: CO2 is separated from the flue gas after combustion. Fossil fuels like coal, oil, natural gas etc. are burnt in the presence of air. Hence, the flue gas is rich in N2 and the CO2 percentage typically varies between 3-15%. Since the partial pressure in CO2 in the flue gas is quite low, very high-volume chemical solvent (amine) circulation is required for CO2 capture. This makes post-combustion technologies energy and cost intensive.
  2. Pre-combustion technologies: This involve removing CO2 through upstream treatment of fossil fuels before combustion. Major difference between pre-combustion & post-combustion is that the former is favoured in cases where the gas stream has a higher partial pressure of CO2, such as in gasification of fossil fuels, natural gas based H2 production or sour gas processing. Since no chemical bonds need to be broken for solvent regeneration, the thermal energy penalty is much lower. The regeneration of physical solvent is primarily achieved by reducing pressure.
  3. Oxy-fuel combustion technologies: While post & pre-combustion carbon capture technologies have been commercially established, oxy-fuel combustion technologies are still in the development stage. Oxy-fuel combustion represents an emerging novel approach to near zero-emission. It is accomplished by burning the fuel in pure oxygen (O2) instead of air (O2 & N2). The flue gas stream would be primarily composed of water & CO2, rather than N2. High-purity CO2 can be recovered by condensation of water.

Direct Air Capture (DAC): DAC directly captures dilute CO2 (at 415 ppm) from the air and may also emerge as a form of carbon capture that has wide applicability, as it is independent of the source and concentration of the emission stream.

However, DAC is still in early stages and the economics and scale of operations are yet to be established.

a S4lT5UyfG6ni58lbbMX11afYdySzKM1RXYnwKseUvrRxU7TivLUqsO P0KvGWVG uHux3TxR4rrePvOIinQw0OYWKRDbh 9FafuFoLAUg9kNhxb6tTNg dTl43qZ9cak97KJf1mT4RIoTO 28H1A

CO2 Capture technologies

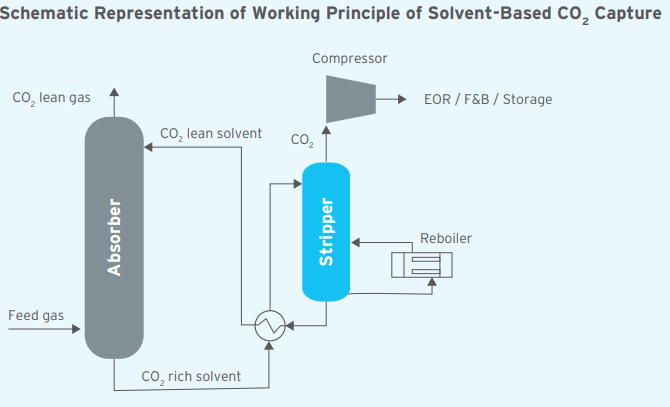
Solvent-based absorption: Solvent based CO2 capture processes have been used for processing natural (sour) gas, combustion flue gas and Fischer-Tropsch (FT) synthesis products. The fundamental principle on which solvent-based CO2 capture technologies work is selective absorption of CO2 over other gaseous constituents.  

The CO2  present in the feed/process gas is first selectively absorbed in an absorber using a solvent (physical  or chemical), the CO2 lean gas exits the absorber. The CO2 rich solvent is sent to a stripper type configuration where CO2 is released from the solvent and the lean solvent is regenerated for reuse. 

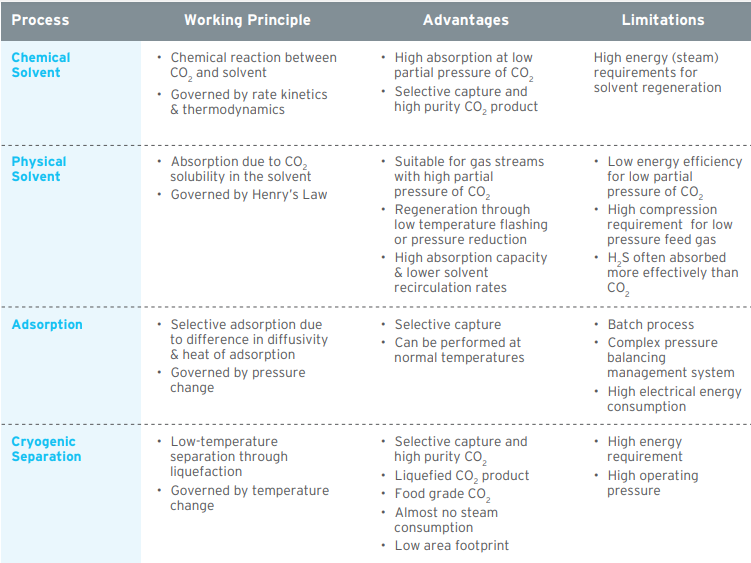
Solvent based CO2 capture technologies are classified into:

Diagram

Description automatically generated
  1. Physical solvent-based absorption: CO2 gets physically dissolved in the solvent. This method performs well at higher partial pressure of CO2. Ex. Higher gas stream pressure and CO2 concentration in Syngas of gasifiers and SMRs make physical absorption-based capture more suitable. 
  2. Chemical solvent-based absorption: CO2 reacts with solvent chemically. This method is better suited for gas-streams having low concentration and partial pressure of CO2 due to the high chemical affinity to CO2 to amine/carbonate based chemical solvents and faster rate kinetics.  Ex. In Low CO2 partial pressures in the flue gas of coal-fired power plants make amine based chemical absorption preferred technique. Common solvents used as: Amine based solvents, Non-Aqueous Solvents, Carbonate-based solvents etc. While primary and secondary amines (such as MEA, DGA, AEE, DEA) have higher reaction rates and lower CO2 carrying capacities, tertiary, and polyamines (such as MDEA and piperazine) have lower reaction kinetics and higher CO2 carrying capacities. 
  3. Adsorption: In this process, CO2 molecules selectively adhere to the surface of adsorbent material and form a film due to difference in diffusivities and heat of absorption values for feed gas stream components. This method is suitable for gas streams with moderate to high pressure and moderate CO2 concentration such as SMR flue gas or BF gas.
  4. Cryogenic separation: This process like conventional distillation process, except that it involves separation of components from a gaseous mixture (instead of liquid) based on the difference in their boiling points. This technology is preferred in cases where cost of power is low. This technology provides a unique advantage by generating additional hydrogen without increasing the amount of feedstock (natural gas)/producing the same quantity of hydrogen with lower natural gas consumption. 
  5. Microalgae based carbon capture: Microalgae utilise the sparsely concentrated CO2 from atmosphere via Carbon Concentrating Mechanism (CCM) and thus are well-qualified for CO2 capture from a more concentrated stream of flue gas. Microalgae use CO2 as a nutrient for cultivation of microalgae. Microalgae can be cultivated in saline water systems as well and do not compete with food crops for arable land for cultivation. Due to faster growth cycle of microalgae, they can typically entrap 10-50 times more CO2 compared to terrestrial plants. They can also deacidify the seawater or wastewater used for their cultivation. This technology is, however, in its nascent stage.
McxDF6Fnc Lzu5od3xS fMEmV1 Z6e0P3w3mpTmp8LahgF2IK8xAFlWJs1VsM4tBUwlduwXQZU5loU woyoZwINJDlOBEUXiD jmXZcGvwrOwg 0RKFyHfoWF2ItWXqQNnvi 9hjlc WtRyaoUoMog

End use of captured CO2 can be either utilisation or permanent storage. 

CO2 UTILISATION TECHNOLOGIES

Rising interest in CCUS as a decarbonisation solution across industries, there is an also a need to look at CO2 utilisation pathways and technologies that are most appropriate for India. Some proven technologies for utilisation of captured CO2 are:

  1. Enhanced Oil Recovery (EOR): CO2 is used in EOR to produce low-carbon oil from maturing oil fields. EOR can help India towards residual oil extraction that is environmentally sustainable and economically feasible.
  2. Green Urea: Urea production from green ammonia can utilise a significant part of CO2. India’s production of ammonia is primarily based on imported LNG. 
  3. F&B applications: CO2 can be utilised in applications such as carbonated drinks, dry ice and modified atmosphere packing. However, scales are quite small compared to the volume of CO2 generation.
  4. Building Materials (Concrete & Aggregates): Utilising CO2 for producing building materials (aggregates & concretes) is likely to be the most attractive and feasible option. CO2 can be used both during concrete curing & aggregate formation. 
  5. Chemicals (Methanol & Ethanol): CO2 can be used production of chemicals such as methanol and ethanol at commercial scales. 

Methanol is a low carbon hydrogen carrier that can support applications like fuel substitution and act as intermediate to produce various speciality chemicals like acetic acid, MTBE, DME and formaldehyde producing products like adhesives, foams, plywood subfloors etc. CO2 hydrogenation process is used to convert captured CO2 into methanol.

Ethanol can be produced by ethylene hydration or biological processes using H2, CO and CO2 by biological gas fermentation process. Ethanol can be blended with Petrol to reduce fuel import bill.

  1. Polymers: CO2 can be converted into various polymers such as polyether carbonates, polycarbonates, diphenyl carbonate, cyclic carbonates etc. A polymer product of CO2 named AirCarbon has found multiple applications (Laptop packaging, cell phone casings, furniture etc.)

CO2 Storage Options

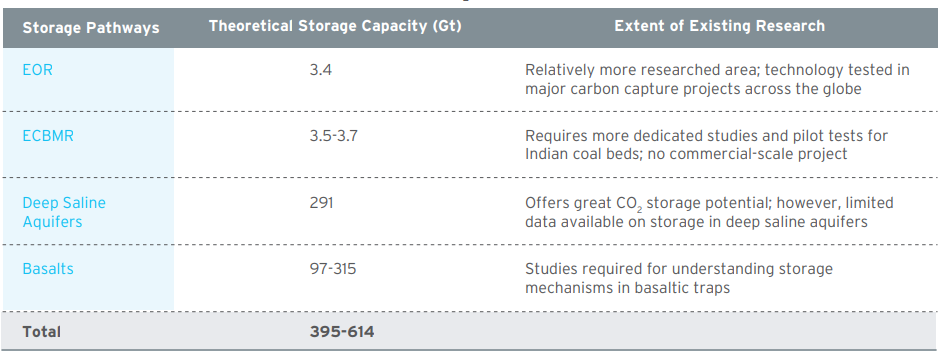
  1. Enhanced Oil Recovery (EOR): Ex. In India, Mumbai High, Assam shelf, Krishna Godavari basin & Cambay basins are prominent sites for storage of CO2. In CO2 EOR, compressed CO2 is injected into the reservoir. At high densities, CO2 is readily miscible with oil. It swells the oil and reduces its viscosity, thereby driving it away from rock formations and towards the production wells. It is estimated that 3.4 Gt of storage is available in India for CO2 storage. 
  2. Enhanced Coal Bed Methane Recovery (ECBMR): In this method, CO2 is injected into unmineable coal seams under supercritical conditions. The CO2 injected is accumulated in the coal cleats in a dense gas phase. This CO2 is adsorbed and absorbed in the coal. Since CO2 has a higher affinity for coal than CBM, it pushes the coal bed methane towards production wells, thus enhancing its primary recovery. Similar to CO2 EOR, ECBMR can help in permanently storing CO2 and the recovered methane can also help offset the cost of carbon captureThe potential for ECBMR is localized in the eastern region due to the presence of major coalfields. These can be storage clusters for industries that are close to the coalfields, such as steel and power plants.
  3. CO2 storage in Deep Saline Aquifers: Captured CO2 can be permanently stored in deep saline aquifers. Deep saline aquifers consist of porous rock formation that contains high quantities of unusable saltwater. Salt/mineral content is very high in this water rendering it unusable for human use. Brine water is called formation liquid and it is trapped by an impermeable rock called caprock. However, compared to EOR or ECBMR, injection of CO2 in deep saline aquifers has no economic benefit.  
  4. CO2 storage in Basalts: Basaltic rocks constitutes divalent cations of Ca, Mg and Fe. They can react with CO2 dissolved in water to form stable carbonate minerals and thus can offer a safe CO2 sequestration method. Compared to saline aquifers, basalt rocks offer faster reaction kinetics due to abundance of iron, calcium and magnesium oxides. Abundance of basalts on Earth’s surface is the reason interest in CO2 storage R&D programs in basalts. 
Table

Description automatically generated with medium confidence

Climate Insurance

Every year, an estimated 26 million people are pushed into poverty by natural disasters which cause an average of $300 billion in economic losses. 

Quick-disbursing financial protection instruments, such as contingent credit and insurance, can reduce humanitarian impacts and save money by enabling rapid crisis response and relief efforts. In Ethiopia, for example, every $1 secured ahead of time for early drought response can save up to $5 in future costs.  

Over the past 10 years, 26 countries in three regions—Africa, the Pacific, and the Caribbean and Central America—have joined sovereign catastrophe risk pools.

What is climate risk insurance?

Climate risk insurance is a type of insurance designed to mitigate the financial and other risk associated with climate change, especially phenomena like extreme weather.

Merits:

  • Insurance solutions can help bolster early action in the face of a disaster, and speed up recovery to restore livelihoods and rebuild critical infrastructure so that people, communities and economies can rebound.
  • Climate risk insurance can help protect individuals, small businesses or entire countries from permanent damage caused by the impact of extreme weather events.
  • Allows countries which are affected by climate change to become more independent; rather than waiting for months, or even longer for international aid to arrive.
  • High-premiums in high risk areas experiencing increased climate threats, would discourage settlement in those areas.

Global example: In 2015, for example, thanks to the insurance policy it purchased through the Pacific Catastrophe Risk Assessment and Financing Initiative (PCRAFI), another World Bank-supported risk finance instrument, Vanuatu received $2 million to support recovery just seven days after cyclone Pam devastated the country. While it may not seem like much, the payout was eight times larger than the government’s emergency budget

Issues:

  • Critics of the insurance, say that such insurance places the bulk of the economic burden on communities responsible for the least amount of carbon emissions.
  • For low-income countries, these insurance programmes can be expensive due to the high start-up costs and infrastructure requirements for the data collection.
  • A considerable problem on a micro-level is that weather-related disasters usually affect whole regions or communities at the same time, resulting in a large number of claims simultaneously.

Way ahead?

  • No one size fits all approach: Localized assessments are imperative in order to understand the needs of vulnerable communities and identify how they can be best prepared in the event of a shock like a natural disaster.
  • Climate risk insurance is no stand-alone solution: It must also always be closely linked with preventive risk management strategies, ensuring losses and damages caused by a natural disaster are kept to a minimum.
  • Affordability: To make insurance affordable, the product can be partly – or fully – subsidized by governments or other donors. Regional risk pools can be created.

Transparency about how money is paid out, collaboration with organizations that have deep roots in the communities, alongside ensuring the participation and inclusion of women must be focussed.