Economy

Additional Tier 1 (AT1 Bonds)

Context:

  • The biggest losers in the Credit Suisse fire sale are investors in the banking major’s riskiest bonds — called Additional Tier 1 or AT1 — who are faced with a $17 billion wipeout, potentially pushing Europe’s $275 billion market for these bonds into turmoil, with likely cascading impact across other geographies.
  • This is the biggest wipeout yet for Europe’s AT1 market.

About AT1 Bonds:

  • AT1 bonds, as these instruments are popularly known, are a type of perpetual debt instrument that banks use to augment their core equity base and thus comply with Basel III norms. These bonds were introduced by the Basel accord after the global financial crisis to protect depositors.

How are these bonds different from other debt instruments?

  • These bonds are perpetual in nature — they do not carry any maturity date. 
  • They offer higher returns to investors but compared with other debt products, these instruments carry a higher risk as well. 
  • If the capital ratios of the issuer fall below a certain percentage or in the event of an institutional failure, the rules allow the issuer to stop paying interest or even write down these bonds. 
  • These bonds are subordinate to all other debt and senior only to equity.

What can investors do with AT1 bonds?

  • AT1 bonds do not have a maturity date. Banks have a call option that permits them to redeem these bonds after a certain period.

Are they safe for investors?

  • Since these bonds can be written down by banks under the directions of the Reserve Bank of India (RBI) in the event of an institutional failure, they are seen as high-risk instruments. 
  • If the bank reaches the point of non-viability, AT1 bonds are the first part of debt that will be written down. 
  • For example, AT1 bonds worth Rs 8,414 crore were written off fully during the Yes Bank reconstruction scheme in March 2020. Those AT1 investors are still locked in a court battle with the RBI and the bank seeking the return of their investments. 
  • In this backdrop, it is fair to say that AT1 bonds are high-risk instruments for investors, especially retail investors.

Why do the banks tap the AT1 bond route?

  • Banks periodically raise money issuing such bonds. 
  • At one point, lenders used to even pitch these to retail investors as an attractive option, often with returns higher than a traditional fixed deposit would offer. 
  • Indeed, there used to be significant retail interest in AT1 bonds till the Yes Bank episode.
  • The market for AT1 bonds took a hit after the Yes Bank write-off, as part of the State Bank of India-led bailout in March 2020. Investors have begun to look at these instruments with caution since then.

Impact of Credit Suisse Crisis on Bond Market:

  • At nearly $130 trillion, the global bond market far outweighs the stock market in size, and plays an outsize role in the global financial system, especially in the way governments raise funds to manage their deficits. 
  • Rumblings in the bond markets could make it harder for other lenders to raise new AT1 debt, especially when the financial sector is facing tough times. 
  • Following FINMA’s announcement of the CHF 16 billion (about $17.3 billion) write-down of Credit Suisse’s AT1 bonds, European and Asian AT1 bonds tanked on Monday. 

Impact on Indian banks:

  • The decision to write down Credit Suisse’s AT1 bonds to zero after the lender’s takeover by UBS may contribute to a higher cost of capital for banks, including Indian lenders. 
  • The write-down will weigh on the pricing of such notes and spook investors.
  • In India, AT1 bonds of Yes Bank were written down in March 2020 after the Reserve Bank of India initiated a restructuring of the troubled lender. Since then, Indian banks have raised AT1 bonds at an up to 75 basis points premium over government bonds.
  • Some bankers, however, do not see a major impact on the fundraising capabilities of Indian banks through AT1 bonds:
    • Spread between regular bonds and AT1 bonds in India is less than 150 basis points, while in the EU and the US, it is 200-250 bps. Indian lenders have limited dependence on such securities. Indian lenders are capable of enduring any potential contagion effects emanating from the US banking turmoil and the Credit Suisse episode given their manageable exposures to global counterparts. 
    • Strong funding profiles, a high savings rate, and government support are among the factors that bolster the financial institutions and that domestic banks had sufficient buffers to withstand losses on their government securities portfolio due to rising interest rates.
Windfall Tax

Context: The Union government scrapped a 30-month old windfall tax on domestically produced crude oil and export of jet fuel (ATF), diesel and petrol following a decline in international oil prices.

Relevance of the topic: Prelims- Key facts about Windfall Tax.

What is the Windfall Tax?

  • A windfall tax is a higher tax levied by the government on specific industries when the industry experiences unexpected and above-average profits.
    • India first imposed the windfall tax on July 1, 2022, when crude oil prices were well over $100 per barrel, following the Russia-Ukraine war.
    • When an industry (in this case oil and gas sector) benefits from a one-off external situation and makes sudden profits, these profits are separately taxed, which are over and above the normal taxes.
  • Country’s upstream oil companies (ONGC, Oil India, GAIL) as well as private refiners Reliance Industries and Nayara Energy, who are the key buyers of discounted Russian supplies, were reaping major profits by aggressively boosting fuel exports instead of domestic sales.

Economic rationale for imposing windfall taxes: 

  • India’s trade deficit had increased to record high levels and a weak rupee had increased the value of India’s imports.
  • Government spending has gone up after it had cut Central Excise Duty and spent more on food and fertilisers.
  • The government then decided to levy windfall tax on oil companies to make up for this gap as the windfall tax adds to the government's earnings.

Economic rationale for removing windfall tax:

  • Falling oil prices; Global crude oil prices have been falling since June 2022, and are currently under $75 per barrel. This has led to a decline in profits for domestic oil producers. 
  • Relief to oil companies: The removal of the tax is expected to benefit major oil producers like Reliance Industries and ONGC by lifting their refining margins. 
  • Relief to consumers: The removal of the tax could lead to lower airfares for airlines, and lower prices for petrol, diesel, and ATF for oil companies. 
  • Reduced government revenue: The windfall tax was not generating significant revenue, with collections dropping from ₹25,000 crore in FY23 to ₹6,000 crore in FY25. 

Sugar Exports

Facts:

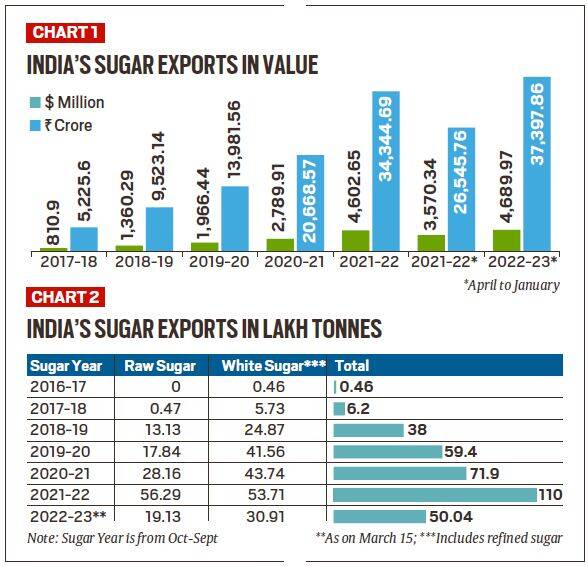
  • Between 2017-18 and 2021-22, sugar exports have soared from $810.9 million to $4.6 billion, and could cross $5.5 billion - or Rs 45,000 crore - in the fiscal year 2022-23.
  • The increase is even more significant in quantity terms. During the 2016-17 and 2017-18 sugar years (Oct-Sept), India’s shipments were a mere 0.46 lakh tonnes (lt) and 6.2 lt respectively, which zoomed to 110 lt by 2021-22.
  • Chart below shows  the value of sugar exports from India in US Dollars and Rupees (2017-18 to 2022-23), increasing year-on-year except in the 2021-22 period.nu5vfFH9f2mBTjjB P7bGHZVpd1m6liLEdM 9x8etXIdV QZ VoEsRHSp488BXjoITigsnt1T2DAAWmB e8TSlJo
  • India’s exports of both raw and white sugar. Chart below shows the quantity in lakh tonnes from 2016-17 to 2022-23. Till 2017-18, India hardly exported any raw sugar.
nu5vfFH9f2mBTjjB P7bGHZVpd1m6liLEdM 9x8etXIdV QZ VoEsRHSp488BXjoITigsnt1T2DAAWmB e8TSlJo
  • The efforts to push exports of raws got a further boost when Indonesia, in December 2019, agreed to tweak its ICUMSA norms to enable imports from India.
  • The Southeast Asian nation previously imported only raw sugar of 1,200 ICUMSA or more, largely from Thailand. Those levels were brought down to 600-1,200 to allow its refiners to process higher purity raws from India.
  • Out of India’s total 110 lt sugar exports in 2021-22, raws alone accounted for 56.29 lt. The biggest importers of Indian raw sugar were Indonesia (16.73 lt), Bangladesh (12.10 lt), Saudi Arabia (6.83 lt), Iraq (4.78 lt) and Malaysia (4.15 lt). 
  • The country also exported 53.71 lt of white/ refined sugar, the leading destinations for which included Afghanistan (7.54 lt), Somalia (5.17 lt), Djibouti (4.90 lt), Sri Lanka (4.27 lt), China (2.58 lt), and Sudan (1.08 lt).

What are Raw and White Sugar:

  • ICUMSA (short for the International Commission for Uniform Methods of Sugar Analysis), is a measure of the purity of sugar based on colour. The lower the value, the more the whiteness.
  • Raw sugar is what mills produce after the first crystallisation of juice obtained from crushing of cane. This sugar is rough and brownish in colour, with an ICUMSA value of 600-1,200 or higher. 
  • Raw sugar is processed in refineries for removal of impurities and decolourisation. The end product is refined white cane sugar having a standard ICUMSA value of 45. The sugar used by industries such as pharmaceuticals has ICUMSA of less than 20.
  • Till 2017-18, India mainly shipped plantation white sugar with 100-150 ICUMSA value. This was referred to as low-quality whites (LQW) in international markets.

Why are Raw Sugar Exports preferable?

  • Ease of Transport and Distribution: Much of the world sugar trade is in ‘raws’ that are transported vessels of 40,000-70,000 tonnes capacity as it requires no bagging or containerisation and can be loaded in bulk. The buyer of raw sugar is the refiner. Whereas, ‘Whites’ are usually packed in 50-kg polypropylene bags and shipped in 12,500-27,000-tonne container cargoes over shorter distances. The buyer of white sugar is the end-consumer.
  • Time Window: The refineries in countries such as Indonesia, Malaysia, South Korea, China and Bangladesh imported raws from Brazil. Brazilian mills operate from April to November, whereas our crushing is from October to April. We told them that they could source our raws during Brazil’s off-season. 
  • Freight Cost Savings: The voyage time from Kandla, Mundra or JNPT to Ciwandan Port of Indonesia is 13-15 days, compared to 43-45 days from Brazil’s Port of Santos.
  • Specific advantages of Indian raw sugar:
    • Dextran free raw sugar: Dextran is a bacterial compound formed when sugarcane stays in the sun for too long after harvesting. Indian raw is produced from fresh cane crushed within 12-24 hours of harvesting. The cut-to-crush time is 48 hours or more in Brazil.
    • Supply of raw sugar with a very high polarisation of 98.5-99.5%: Polarisation is the percentage of sucrose present in a raw sugar mass. The more the polarisation — it is only 96-98.5% in raws from Brazil, Thailand and Australia — the easier and cheaper it is to refine.
    • Enhanced awareness about the quality of Indian raw sugar: enables our raws today fetch a 4% premium over the global benchmark (New York No. 11 futures contract) price. This is in contrast to white sugar as our LQW sells at a $40/tonne discount to the world price (London No. 5 futures).

Challenges:

  • Dwindling availability for domestic market: Year-end stocks of sugar with Indian mills peaked at 143 lt in 2018-19. The concerted export drive, coupled with diversion of sugarcane juice to produce ethanol for blending with petrol, helped bring down closing stocks to about 70 lt by 2021-22 which was enough for just over 3 months of domestic consumption. This is in contrast to 2017-18, where closing stocks of sugar at 105 lt  enabled stocks accumulation to 5 months of domestic consumption.
  • Caps on Exports: Lower stocks and production dipping to an estimated 334 lt (from 359.25 lt in 2021-22) has led the government to cap India’s exports in the current sugar year to 61 lt. Out of that, over 50 lt have already been dispatched.
  • Reduced price realisation of sugar farmers: Mills in Maharashtra are now realising around Rs 32 for every kg of sugar sold in the domestic market. As against this, London white sugar prices are ruling at $585 per tonne. Even after factoring in the $40/tonne LQW discount and deducting Rs 2,500-3,000/tonne of internal transport and port expenses, the ex-mill realisations from exports work out much higher, at Rs 42-42.5/kg.

Way Forward:

  • The government may be concerned about domestic availability and food inflation. But overseas markets lost aren’t easy to regain.
  • Building export markets takes effort. Overseas buyers need to be convinced about the price competitiveness, product quality, and reliability of supplies from the exporting country.

Additional Surveillance Measure (ASM)

  • In order to enhance market integrity and safeguard interest of investors, Securities and Exchange Board of India (SEBI) and Exchanges have been introducing various enhanced pre-emptive surveillance measures such as reduction in price band, periodic call auction and transfer of securities to Trade for Trade segment from time to time.
  • In continuation to various surveillance measures already implemented, SEBI and Exchanges have decided that along with the aforesaid measures there shall be Additional Surveillance Measures (ASM) on securities with surveillance concerns based on objective parameters viz. Price / Volume variation, Volatility etc.

There are two types of ASMs:

  • Short-term additional surveillance measures .
  • Long-term surveillance measures. 

Stocks that are moved to ASM can’t be pledged. If in case a stock that you have pledged is moved under ASM then you can’t receive collateral margins for it.

This is because according to ASM, 100% of the margin has to be levied.

The collateral value will decrease by the value of collateral obtained against that particular stock. Investors have the option of unplugging the stock or keep it pledged without collateral till it is removed from ASM.

Please note that corporate actions are not affected if a stock is under ASM. The shareholders are still eligible for all corporate benefits like bonus, dividend, stock split, etc. even when the stock is under ASM.

Supreme Court directs govt. to clear  ₹28,000crore OROP arrears by February next year

Context:

  • The Supreme Court on March 20 gave the government leeway to pay in installments ₹28,000 crore in arrears due to veterans under the One Rank One Pension (OROP) scheme.
  • The staggered payment of OROP arrears would be made to various categories of eligible pensioners, totaling 21 lakh persons, from April 2023 till February 2024.
  • The entirety of the arrears was supposed to be paid by March 2023, according to an earlier deadline given by the court.

What is One rank, one pension? 

  • OROP means that any two military personnel retiring at the same rank, with the same years of service, must get an equal pension.
  • While this might appear almost obvious, there are several reasons why two military personnel who may have retired at the same rank with the same years of service, may get different pensions.
  • Military personnel across the three services fall under two categories:
    • The officers and the other ranks. 
    • The other ranks, which are soldiers, usually retire at age 35. Unlike government employees who retire close to 60, soldiers can thus miss out on the benefits from subsequent pay commissions. And since pensions are based on the last drawn salary, pensions, too are impacted adversely.
    • Similarly, the age when officers in the military retire depends upon their ranks. The lower the rank, the earlier they superannuate. But the problem is not just that.
  • Benefits of Pay commissions not reaching Servicemen: 
    • The benefits of the successive pay commissions were not passed to servicemen who had retired earlier. 
    • Pensions differed for those who had retired at the same rank, with the same years of service, but years apart.

Why is there an issue with OROP arrears?

  • After the government’s December 2022 decision — further reiterated by a government order issued in January this year — a group of ex-servicemen moved the apex court seeking that the arrears be paid in a single instalment instead of four instalments.
  • The January order stated that the OROP arrears would be paid in four half-yearly installments.
  • The ex-servicemen in its plea said the Centre, by issuing this order, subverted the apex court’s March 2022 order, in which it had said that arrears payable to all eligible pensioners of the armed forces shall be computed and paid over accordingly within a period of three months.

What are the Centre’s issues with clearing OROP arrears in one go?

  • As per officials in the government, the cabinet note, which was approved by the union cabinet last year, had mentioned that installments be cleared in four installments, barring exceptions.  
  • While the government did make an appropriation of 28,138 crores in the budget for 2023-24 for payment of OROP arrears, officials explained this does not mean that this entire budget is available to the government for a lump sum payment.
  • They said for every installment paid, the Ministry of Finance will have to balance cash inflows and outflows — in the absence of which the government might need to go for additional borrowings to fill the deficit. Currently, the government is not in favour of such a move.

National Champions and Infrastructure

What are National Champions:

  • National champions refer to private corporations that, although technically operating as private businesses, have been granted a dominant position in the national economy through government policies.
  • These corporations are expected to not only pursue profit but also to promote the nation's interests, and the government implements policies that favour them.
  • This approach is employed by several governments, with some sectors like defence receiving more attention than others.
  • However, the policy's unfair advantage over competitors in the market promotes economic nationalism within the country and global dominance abroad, contradicting the principles of a free market.

Importance of Infrastructure:

  • Infrastructure in emerging economies has taken on aspects of a magic bullet. Infrastructure has seemingly become both a demonstration good and a necessity.
  • It simultaneously works as a:
    • National aspiration good
    • Barometer of national progress
    • Mechanism for job creation
    • Vehicle for crowding in private investment.

Constraints on infrastructure provision:

  • It needs to be built to a minimum scale, which makes it expensive to finance and maintain.
  • It often has a public good component which makes the social value of infrastructure higher than its private value to individual users. Hence, private investors tend to find such investments relatively unprofitable.

Approach to Finance Infrastructure Projects:

  • The traditional approach - through tax revenues or government borrowing.
    • Risks of vicious trap in traditional approach:
      • Poorer economies generate less tax revenue, which limits infrastructure investment.
      • This reduces returns to private investment with further spinoffs that affect the growth of the economy and keep the country poor.
      • Attempting to break the cycle by increasing public borrowing domestically tends to crowd out private investment.
  • Newer approach - incentivise private sector participation by providing targeted subsidies for infrastructure investments.
    • India introduced the Public-Private-Partnership (PPP) model in early 2000s.
    • The arrangement entailed the government facilitating acquisitions of land and primary commodities, as well as access to credit from public sector banks for infrastructure projects.
    • Armed with these implicit and explicit subsidies, the private sector got to construct and run the projects for a designated period of time.
    • Risks with PPP model:
      • The PPP model ended in an avalanche of non-performing assets with public sector banks, private sector bankruptcies, accusations of widespread corruption, and a change in government in 2014.

“National Champions” Model in India:

  • Modification of the PPP approach - “National Champions” model - where the government picks a few large conglomerates to implement its development priorities by assigning the bulk of the infrastructure provisioning for roads, ports, airports, energy, and communications to them.
  • Three new aspects to the national champions model.
    • Firstly, infrastructure ventures usually require a significant amount of time before they begin to produce modest returns. In order to motivate investments in such undertakings, it's necessary to give control of already established projects with robust cash flows to these champions. This strategy enables conglomerates to attain their desired overall returns while still retaining less profitable ventures.
    • Secondly, when the champions are publicly linked with the national development policy of the government, they gain a competitive edge in securing both domestic and foreign contracts. This association also ensures a dependable cash flow for them.
    • Thirdly, National champions having access to cash-rich projects can utilise these projects as collateral to borrow from external credit markets, resulting in decreased financial costs for their other projects. Moreover, it also enables domestic savings to be allocated towards private investment. This innovative approach is a smart solution.
  • Problems associated with the “national champions” model:
    • First, the direct connection between these large corporations and government policies can lead to the perception that they are "too big to fail," which in turn can result in market frenzy, delayed identification of problems, and the spreading of sector-specific issues to the wider economy, as exemplified by the recent difficulties faced by the Adani groups.
    • Second, such an environment of market concentration can often have negative consequences for efficiency and productivity on a national level.
    • Third, when it takes longer for projects to generate substantial cash flows, there may be a greater reliance on state support to provide access to additional capital, which carries the risk of turning the country into an industrial oligarchy.
    • Fourth, the appearance of an uneven playing field with regards to market access and selective regulatory leniency can discourage foreign investors, which would be a significant setback for India.

Way Forward:

  • A deeper issue is with regard to the proposition that infrastructure provision is the solution to India’s growth aspirations. The prevailing thinking is that once the ports, roads, power, etc. are in place, private investment will follow.
  • India is at an inflection point in its development path. It has bet on a development model based on a domestic demand-driven production structure, powered by soft and hard infrastructure that is heavily concentrated in a few hands.

Electronic-Negotiable Warehouse Receipts

About Warehousing Development & Regulatory Authority (WDRA)

  • WDRA is a statutory body created under the Warehousing (Development & Regulation) Act, 2007 and shall have the duty to regulate and ensure implementation of WDRA, 2007 and promote orderly growth of warehousing business.
  • It is headed by a Chairman and two full-time members.
  • WDRA aims to ensure that interests of farmers are protected through
    • Growth and development in warehousing sector.
    • Improve fiduciary trust of depositors and banks.
    • Increase in liquidity in rural areas.
    • Encourage scientific warehousing of goods.
    • Lower cost of financing.
    • Promote shorter and efficient supply chains.
    • Enhance reward for grading and quality.
    • Ensure better price risk management.
  • Only Warehouses registered with the WDRA can issue negotiable warehouse receipts.
  • Requirements for warehouses for registration with WDRA:
    • Warehouse should be constructed as per BIS/CWC/FCI standards and is storage worthy.
    • Has all safety and security arrangements for stock and premises.
    • Has got requisite manpower with adequate experience in warehousing.
    • Availability of requisite infrastructure in weighing, grading and preservation.
    • Warehouse should have its own Standard Operating Procedures (SOPs) or adopts model SOP of WDRA.
    • Adequate insurance is taken for stock against fire, theft, burglary, misappropriation, riots, strikes or terrorism.
    • Financial network and security deposit for securing negotiable warehouse receipts issued.
  • Commodities covered against which NWRs can be issued by WDRA: Currently, 136 agricultural commodities including cereals, pulses, oilseeds, spices, rubber, tobacco, coffee etc. are notified under the WDRA Act for issuing negotiable warehouse receipts. Also, 24 horticultural commodities for cold storage and 9 non-agricultural commodities have been notified. 

About Negotiable Warehouse Receipts (NWRs):

  • NWRs issued by WDRA will help farmers to seek loans from banks against the NWRs to avoid distress sales of agricultural produce during the peak marketing season and to avoid the post-harvest storage loss. WDRA Act allows issue of NWRs in writing form or electronic form.
  • Benefits of NWRs
    • Increased liquidity in rural areas.
    • Encouragement of scientific storage of goods and thereby reducing post-harvest losses.
    • Lower cost of financing
    • Shorter and more efficient supply chains
    • Enhanced rewards for standard section, grading and quality.
    • Better price risk management
    • Better returns to farmers and better services (Quality of Goods) to consumers.

About Electronic Negotiable Warehouse Receipt (e-NWRs):

  • According to Amendment to Warehousing (Development & Regulation) Registration of Warehouses Rules, 2017, no registered warehouses under the WDRA act will issue NWRs in physical form and shall register with one or more repositories registered with WDRA for issuing negotiable warehouse receipts has migrated to system of launching electronic Negotiable Warehouse Receipt in 2018 which is a IT based eNWR ecosystem.
  • Repositories for eNWRs: Two repositories have been notified for issuing eNWRs: National E-Repository and CDSL Commodity Repository.
  • Benefits of eNWR
    • Avoidance of forgery/loss/tamper/mutilation of a physical NWR.
    • Avoidance of multiple financing against the same NWR.
    • Reduction of monitoring costs and building credibility amongst market participants.
    • Market participants to have secured accessible to view and manage their warehouse receipts via online portal.
    • Easy access to finance by enabling multiple transfers without physical movement of goods.
    • Splitting of NWRs for partial sale/pledge/withdrawal.

Steps for Mainstreaming of eNWRs

  • RBI’s Priority Sector Lending Guidelines prescribes for loan against pledge/hypothecation of agricultural produce. Thus, loans up to Rs 75 lakhs can be given against eNWRs.
  • Integration of e-NWRs with e-NAM Platforms: farmers/holders of an e-NWR issued by a registered warehouse can sell their underlying stocks on e-NAM platform and have better price discovery. The registered warehouse is required to be declared as a market sub-yard by the state authority for trade on e-NAM APMC market.

Challenges restricting expansion of NWR ecosystem:

  • Warehousing sector has been mostly un-organised and highly fragmented.
  • Registration of warehouses is voluntary and hence scope for increase in the number of registered warehouses is limited.
  • There is inadequate regulatory framework under the Act.
  • Registration system and issuance of NWRs had been paper based.
  • Monitoring & surveillance system of registered warehouses had been inadequate.

Way Forward

  • Easier registration of warehouses with WDRA.
  • Making it mandatory for newer warehouses getting assistance under government schemes to register with WDRA.
  • Training and capacity building of warehousemen.
  • Awareness among farmers about benefits and access of Negotiable Warehouse Receipts.

International Grains Council

About International Grains Council

  • International Wheat Council as established by the International Wheat Agreement, 1949 was renamed as International Grains Council by the Grains Trade Convention, in 1995. It is located in London.
  • International Grains Council is an inter-governmental organisation that administers the Grains Trade Convention.
  • Scope: Food Items Covered under the definition of Grains are Rice (added later), Pulses (added later), barley, maize, oats, rye, sorghum,  triticale and wheat and their products.
  • Functions of International Grains Council:
    • Further international cooperation in grain trade.
    • Promote expansion, openness and fairness in grains sector.
    • Contribute to grain market stability and enhance world food security.
    • Forum for exchange of information and discussion of members regarding trade in grains
  • International Grains Council has been formed under the Grains Trade Convention, 1995 and also administers the GTC.
  • Membership: Membership of IGC consists of all parties to the Grain Trade Convention, 1995 with 30 countries as members. Each member is designated as an importer or exporter based on its average trade in grains, rice and oilseeds. India is a member of this organisation. Department of Food & Public Distribution under Ministry of Consumer Affairs, Food & Public Distribution Acts as the nodal agency on behalf of government of India in International Grains Council. 
  • Chairperson and Vice-Chairperson of this council are elected annually by the council.
  • IGC holds two regular Council Sessions each year, either in London or by invitation in member countries.
  • IGC also acts as the secretariat of Food Assistance Convention, 2013. (Food Assistance Convention aims to reduce hunger, improve food security and improve nutritional status of the most vulnerable populations. India is not a party to this convention).

Initiatives of the International Grains Council

  • Grains & Oilseeds Index: An index developed by International Grains Council which provides daily updates on variation of prices of commodities covered by International Grains Council.
  • Grain Market Report: It is a monthly publication that reviews the situation and outlook for wheat (including durum), maize (corn), barley, sorghum, oats, rye, rice, soybeans, soy meal and rapeseed/canola markets.
  • Agricultural Market Information System (AMIS): International Grains Council joined the Secretariat of Agricultural Market Information System (AMIS) in 2012. AMIS was established at the request of Agriculture Ministers of G20. It covers four crops (Wheat, Maize, Rice and Soyabeans). AMIS aims to promote food market transparency and coordination of policy action in response to market uncertainty.

Grains Trade Convention, 1995 (GTC)

  • GTC is the only international treaty covering trade in grains, rice and oilseeds trade.
  • Scope: Food Items Covered under the definition of Grains are Rice (added later), Pulses (added later), barley, maize, oats, rye, sorghum,  triticale and wheat and their products.
  • Recently, Egypt which is one of the largest importers of Wheat in the world, withdrew from the Grains Trade Convention, 1995.

Rising Milk Prices

Context:

  • Within the last year, the Gujarat Cooperative Milk Marketing Federation has raised the maximum retail price (MRP) of its Amul brand full-cream milk (containing 6% fat and 9% SNF or solids-not-fat) in Delhi from Rs 58 to Rs 64 per litre.
  • The National Dairy Development Board (NDDB)-owned Mother Dairy went further — from Rs 57 to Rs 66 per litre — between March 5 and December 27, 2022.

Reasons for the price rise:

  • Crash in prices following the Covid-induced lockdowns as a result of demand destruction led dairies to slash procurement prices of milk and its products. Farmers responded by:
    • Shrinking (or at least not expanding) the size of their herds, as milk prices would not cover the cost of feeding and maintaining the animals
    • Underfeeding the calves and the pregnant/ dry cattle who did not give milk. The calves that were underfed during the lockdown are today’s cows. Most of them, even if they have survived, are poor milkers. This is evidenced by dairies across India reporting lower milk procurement
  • Supply side issues - Increase in cost of animal feed:
    • The cattle feeding cost alone has increased by around 20% compared to last year, on the back of more expensive ingredients such as cotton-seed, rapeseed and groundnut extractions, soybean meal, maize, de-oiled rice bran and molasses.
    • Availability of straw (particularly wheat, due to a poor 2021-22 crop) and fodder (because of near-incessant rains, especially in the South, from October-December 2021 through 2022, which did not allow the grass to fully come out) has also been an issue.
    • Zoonotic Diseases: Some major milk-producing states have seen a rise in cases of disease among cattle. Lumpy Skin Disease, which leads to fall in milk output, has been reported in Gujarat, Punjab and Haryana.
    • There has also been a rise in transport, logistics, manpower, and energy costs.
  • Demand side issues - the lifting of lockdown restrictions and revival of economic activity from late-2021 coincided precisely with the building up of supply pressures.
    • This was exacerbated by India exporting more than 46,000 tonnes of milk fat between April 2021-November 2022, against a mere 15,600 tonnes in 2020-21.
    • Higher exports of butter, ghee, and anhydrous milk fat, enabled by soaring international prices, have added to the domestic shortage.

Way Forward:

  • Allow duty-free imports of butter oil and SMP. Butter fat imports currently attract 40% duty. For SMP imports, it is 15% up to 10,000 tonnes per year and 60% for quantities more than that.
  • The government can permit NDDB to import fat and SMP at zero duty for building up a buffer stock necessary for the summer, when milk supplies will dry up in the normal course.

Distribution of Net Proceeds among States

Context: 

  • With population given a higher weightage over performance, the revenue-sharing formula has created friction between States and the Centre.
  • Southern states feel that horizontal distribution of net proceeds by the Centre as per formula suggested by 15th Finance Commission are “inequitable”, putting them at a disadvantage vis-a-vis Northern states.

Facts:

  • The Centre’s tax collections are pooled-in from States and a part of it is distributed among them, based on the Finance Commission’s (FC) formula. 
  • The share of taxes that each state gets is decided by a formula. The largest weight in this formula is given to what is called the “income distance” parameter, which is essentially the inverse of the per capita income of a state. Thus, the lower the per capita income, the more the state gets.
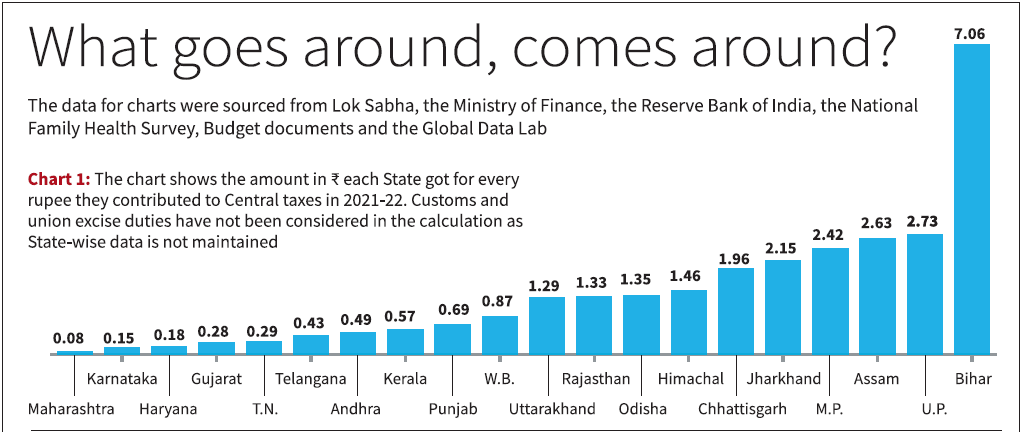
  • India’s poorest states, Bihar and Uttar Pradesh, therefore, have the highest share in tax devolution to states, much higher than they would get if population was the only parameter
  • The 15th FC formula is skewed in favour of some States, resulting in wide inter-State variations. As population is given a higher weightage, it tilts the balance in favour of some northern States. 
  • For every one rupee that Tamil Nadu gives the Centre, it gets back 29 paise. On the other hand, Uttar Pradesh gets ₹2.73, and Bihar gets back ₹7.06.
gBk
  • The 15th FC had arrived at the States’ share in the divisible pool of taxes based on each State’s needs (population, area and forest and ecology), equity (per capita income difference) and performance (own tax revenue and lower fertility rate).
  • The weight assigned to needs was 40%, equity 45%, and 15% for performance.
    • This formula meant that Uttar Pradesh and Bihar got 17.9% and 10%, respectively in the XVFC. Karnataka, Kerala and Tamil Nadu got 3.65%, 1.93% and 4.08%, respectively. 
    • Chart below shows that in successive FCs, the share of southern States has seen a consistent decline.
ZiAmM0WgbmJKzxk xX6tK0jkflisUZc6APQaXwCw7vze bHT8sxa1O5jKm3SfqoNl1wb72sUPYl YXNSuH7yLoppM Clw0wwig9z l5j9 zoKo y2gm8wpJjVd6kfQK6bh6 Y208AfLUDo6rcgYvA
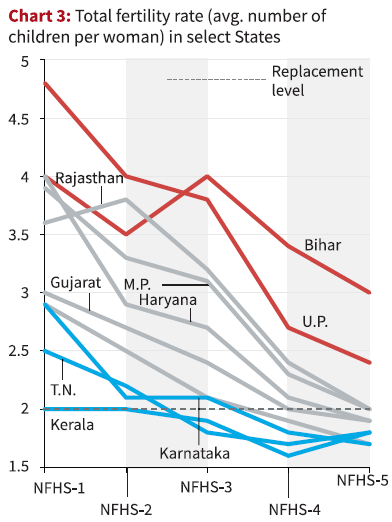
  • Also, the 15th FC introduced the fertility rate in the formula to reward States which had reduced the fertility levels.
  • While this does favour the developed States which have pushed their TFR below replacement rate as shown in the chart below, the weightage given to the component is relatively lower than equity and need
nn6ODZJjgRXuR8p9z2uhIR0VZNAL7t NjfSUg6TWfIBCT1kMoB45 ZleaEUuskPhvGEz43sQWyMKFOPTd8ZwD9BuF3y8kQ

Rationale for Equitable Distribution

  • Active state intervention was envisaged to reduce the developmental disparities. 
  • The mechanism employed to achieve these goals was the transfer of resources from the Centre to the states.
  • These transfers, which are more heavily directed to populous and poorer states, were channelled in the past through the Finance Commission and the Planning Commission.

Arguments:

  • In Favour: The objective is not to return the money you get from a State. Transfers enable a State to provide comparable levels of services. The basic rationale is horizontal equity. Taxes accrued to Tamil Nadu are not necessarily from the State. Yes, per capita income levels increased substantially in Karnataka, Kerala and Tamil Nadu. Now, the increase need not necessarily have to do only with the States’ efforts.
  • Against: The southern States have grown faster, and contribute larger revenue to the central kitty. The argument is that both Northern as well as Southern states should get equally higher amounts. Equity needs to be balanced so that it does not adversely impact efficiency of Southern states. The Centre needs to incentivise developing States to generate more tax revenue for an even more effective distribution.

Article 280 of the Indian Constitution:

  • Clause (1): The President shall, within two years from the commencement of this Constitution and thereafter at the expiration of every fifth year or at such earlier time as the President considers necessary, constitute a Finance Commission which shall consist of a Chairman and four other members to be appointed by the President.
  • Clause (2): Parliament may by law determine the qualifications which shall be requisite for appointment as members of the Commission and the manner in which they shall be selected.
  • Clause (3): It shall be the duty of the Commission to make recommendations to the President as to:
    • (a) the distribution between the Union and the States of the net proceeds of taxes which are to be, or may be, divided between them under this Chapter and the allocation between the States of the respective shares of such proceeds;
    • (b) the principles which should govern the grants in-aid of the revenues of the States out of the Consolidated Fund of India;
    • (bb) the measures needed to augment the Consolidated Fund of a State to supplement the resources of the Panchayats in the State on the basis of the recommendations made by the Finance Commission of the State; 
    • (c) the measures needed to augment the Consolidated Fund of a State to supplement the resources of the Municipalities in the State on the basis of the recommendations made by the Finance Commission of the State;
    • (d) any other matter referred to the Commission by the President in the interests of sound finance.
  • Clause (4): The Commission shall determine their procedure and shall have such powers in the performance of their functions as Parliament may by law confer on them.

15th Finance Commission:

Criteria for Horizontal distribution of taxes among States:

  • The criteria for distribution of central taxes among states for the 2021-26 period is the same as that for 2020-21.
Criteria14th Finance Commission15th Finance Commission
Income Distance5045
Population (1971 Census)17.5Not Considered
Population (2011 census)1015
Demographic PerformanceNot Considered12.5
Forest Cover7.5Not Considered
Forest and EcologyNot Considered10
Area1515
Tax EffortNot considered2.5
Total100100

Way Forward:

  • The inequalities between rich and poor states are manifest in almost every economic dimension. Incomes, assets and discretionary purchasing power are higher in the richer states. They are the locus of formal employment and of high value jobs, which is why the hunger for government jobs is so much more intense in the poorer regions of India. The overwhelming majority of foreign investment comes to the richer states. They have better healthcare, higher levels of literacy and better public services than the poorer states.
  • Therefore, any scheme of allocation should take into account both development needs as well as past performance, with the latter serving both to incentivize better performance and to allocate resources where they can be most effectively used.
  • ‘Committee for Evolving a Composite Development Index of States’ in 2013 proposed a general method for allocating funds from the Centre to the states based both on a state’s development needs as well as its development performance.
  • The methodology developed by the Committee first allocates funds across states based on need. Need is based on a simple index of (under) development. The index proposed here is an average of the following ten sub-components: (i) monthly per capita consumption expenditure, (ii) education, (iii) health, (iv) household amenities, (v) poverty rate, (vi) female literacy, (vii) percent of SC-ST population, (viii) urbanisation rate, (viii) financial inclusion, and (x) connectivity.
    • The proposed allocation scheme accommodates differences in needs, even while recognizing that the truly needy should be given disproportionately more. Less developed states rank higher on the index, and would get larger allocations based on the need criteria.
  • Given that poor administration or weak institutions in a recipient state can fritter away allocated resources to the detriment of the population, there should be some recognition for effective governance and the efficiency of resource use. This becomes all the more necessary since the proposal to give substantially more to underdeveloped states might create a mild disincentive to develop.
  • In sum, 8.4% of funds will be allocated as a fixed basic allocation. Of the remaining 91.6%, we choose parameters such that 3/4th of it is allocated based on need and 1/4th based on performance. 
  • A positive feature of this formula for allocation of funds is that the incremental reward for performance is increasing in the level of underdevelopment – this is because the reward for performance is multiplied by need.

Domestic Systemically Important Banks (D-SIBs)

Under the D-SIB framework, the RBI was required to disclose the names of banks designated as D-SIBs, and to place them in appropriate buckets depending upon their Systemic Importance Scores (SISs).

Depending on the bucket in which a D-SIB is placed, an additional common equity requirement is applicable to it. The additional CET1 requirement was in addition to the capital conservation buffer. It means that these banks have to earmark additional capital and provisions to safeguard their operations.

Background:

  • The Basel, Switzerland-based Financial Stability Board (FSB), an initiative of G20 nations, has identified, in consultation with the Basel Committee on Banking Supervision (BCBS) and Swiss national authorities, a list of global systemically important banks (G-SIBs).
  • There are 30 G-SIBs currently, including JP Morgan, Citibank, HSBC, Bank of America, Bank of China, Barclays, BNP Paribas, Deutsche Bank, and Goldman Sachs. No Indian bank is on the list.

Why create SIBs?

  • 2008 crisis - problems faced by large and highly interconnected financial institutions hampered the orderly functioning of the global financial system - negatively impacting the real economy.
    • Government intervention - became necessary to ensure financial stability.
    • Cost of public sector intervention, and the consequential increase in moral hazard, required that future regulatory policies should aim at reducing the probability and the impact of the failure of SIBs.
  • In October 2010, the FSB recommended that all member countries should put in place a framework to reduce risks attributable to Systemically Important Financial Institutions (SIFIs) in their jurisdictions.
  • SIBs are perceived as banks that are ‘Too Big To Fail (TBTF)’, due to which these banks enjoy certain advantages in the funding markets.
    • However, this perception creates an expectation of government support at times of distress, which encourages risk-taking, reduces market discipline, creates competitive distortions, and increases the probability of distress in the future.
    • It is therefore felt that SIBs should be subjected to additional policy measures to guard against systemic risks and moral hazard issues.
  • While the Basel-III Norms prescribe a capital adequacy ratio (CAR) — the bank’s ratio of capital to risk — of 8%, the RBI has been more cautious and mandated a CAR of 9% for scheduled commercial banks and 12% for public sector banks.

Two-step process to assess the systemic importance of banks:

  • First, a sample of banks to be assessed for their systemic importance is decided. All banks are not considered — many smaller banks would be of lower systemic importance, and burdening them with onerous data requirements on a regular basis may not be prudent.
    • Banks are selected for computation of systemic importance based on an analysis of their size (based on Basel-III Leverage Ratio Exposure Measure) as a percentage of GDP. Banks having a size beyond 2% of GDP will be selected in the sample.
    • Once the sample of banks is selected, a detailed study to compute their systemic importance is initiated. Based on a range of indicators, a composite score of systemic importance is computed for each bank.
    • Banks that have a systemic importance above a certain threshold are designated as D-SIBs.
  • Second, the D-SIBs are segregated into buckets based on their systemic importance scores, and subjected to a graded loss absorbency capital surcharge, depending on the buckets in which they are placed.
  • A D-SIB in the lower bucket will attract a lower capital charge, and a D-SIB in the higher bucket will attract a higher capital charge.

Bio & Organic Fertilisers

NITI Aayog has released a report on the promotion of Bio and Organic Fertilisers.

Organic Fertilisers

  • Organic fertilisers are substances made up of one or more unprocessed materials of a biological nature (plant/animal) and may include unprocessed mineral materials that have been altered through the microbiological decomposition process.
  • Organic fertilisers are composted/fermented products made from organic wastes (city waste, agro-waste, crop residue, livestock waste, food processing industry waste etc.)
  • Organic fertilisers specified under FCO, 1985 are classified into the following categories:
  • City compost
  • Vermicompost
  • Phosphate-rich organic manure
  • Organic manure
  • Bio-enriched organic manure
  • Bone meal (raw/steamed)
  • Potash derived from rhodophytes
  • Fermented organic manure
  • Liquid-fermented organic manure

Biofertilisers

  • Biofertilisers are different from organic fertilisers. Biofertilisers are defined as a product containing carrier-based (solid or liquid) living microorganisms which are agriculturally useful in terms of nitrogen fixation, phosphorus solubilisation or nutrient mobilisation, to increase the productivity of soil and/or crop (FCO 1985).
  • Upon application to seed or soil, these microbial preparations multiply rapidly around emerging crop roots and fix/mobilise nutrients from air and soil, from unavailable form to available form.
  • Nutrient solubilisers (P, K or Zn solubilizers) transform insoluble nutrients present in the soil to soluble form for easy uptake by crop plants.
  • Average dose of mixed bio fertilisers application is 6 litre/hectare for liquid formulations and 12 kg/hectare for solid carrier-based for solid carrier-based, for fixation/solubilisation of 20-25 kg nutrients/hectare.
  • Biofertilisers are available in four different forms:
    • Nitrogen fixers (Rhizobium, Azotobacter, Azospirillum, Gluconacetobacter)
    • Phosphorus solubilisers (Wide range of bacteria, fungi and Mycorrhiza)
    • Potassium solubilisers (Bacillus mucilaginous, Bacillus edaphicus, Bacillus circulanscan, Frateuriaaurentia)
    • Zinc and other micronutrient solubilisers.

Regulation of Organic & Biofertilisers

  • Organic & Biofertilisers are regulated by the Fertiliser (Inorganic, Organic or Mixed) (Control) Order (FCO, 1985) under the Union Ministry of Agriculture & Farmers' Welfare.
  • Currently, 11 bio fertilisers & 10 organic fertilisers are approved under FCO for use in India as of now.

Need for promoting organic and biofertilisers

  • Sustainable Agriculture: Organic and chemical-free agriculture can reverse environmental ill effects like groundwater depletion and loss of biodiversity etc primarily caused due to overuse of chemical fertilisers and pesticides after the green revolution.
    • Nutrient run-off from farms laced with chemical fertilisers adversely affects land ecosystems.
    • Ammonia emissions from agricultural activities can combine with vehicle exhausts to create dangerous particulates in the air and exacerbate respiratory diseases.
    • Chemical fertiliser production and use also lead to significant greenhouse gas emissions.
  • Promoting Soil Health: India's soil is getting depleted of organic matter. Nutritional quality of food produced from soil poor in organic matter is also poor. Organic and bio fertilisers conserve the micro-fauna of soil and act as a natural surface purifier. Dung manure contains basic elements critical to plant health i.e., nitrogen (N), phosphorus (P), potassium (K) and several micronutrients. Also, humus in dung manure act as a soil amender and preserves moisture in the soil. Application of organic and bio fertilisers will lead to the sustainability of agriculture.
  • Incomes for farmers and gaushalas: Promoting the use of cow dung manure will improve economy of gaushalas, support natural farming and improve sustainability of agriculture.
  • Address the problem of stray cattle: Promoting use of cow and animal waste-based organic and bio-fertilisers will address the issue of stray cattle which has led to a big menace in rural areas.
  • Waste management: Production of bio and organic fertilisers from animal waste, cow dung etc. will help to sustainably address the issue of waste management in rural areas.
  • Less input cost of agriculture: Increasing the use of bio and organic fertilisers will reduce the input cost of farming and is expected to increase the incomes of farmers over the long term.
  • Reduced expenditure on fertiliser subsidy: Fertilisers subsidy alone accounts for more than Rs 1,50,000 lakh crores per year. This increases the fiscal deficit of the government. This can be reduced if we promote the use of bio and organic fertilisers.
  • Fertiliser security: Most chemical fertilisers have to be imported into India as India lacks domestic sources of phosphorous, potassium and urea. This dependence on imports exposes Indian agriculture to supply chain constraints. Thus, promoting bio and organic fertilisers will come to the fertiliser supply more assured.

Government Initiatives for Promoting Organic and Biofertilisers

  • Paramparagat Krishi Vikas Yojana
  • Mission Organic Value Chain Development for North Eastern Region
  • Namami Ganga Program
  • National Program for Organic Production
  • Capital Investment Subsidy Scheme (CISS)
  • Soil Health Management Scheme
  • Policy on Promotion of City Compost
  • New National Biogas and Organic Manure Programme (NNBOMP)
  • Government has set a target to bring additional 10 lakh hectares under organic farming in the next 3 years.

Challenges

  • Heavy subsidies on chemical fertilisers especially urea discourage the use and uptake of organic fertilisers and biofertilisers, which do not get any subsidy.
  • Limited R&D in the field of organic & bio fertilisers.
  • Lack of regional resource centres for the supply of authentic and efficient microbial strains; Lack of awareness of biofertilisers for proper preservation, sub-culturing, storage, and procurement of authentic strains suitable for local environmental conditions.
  • Lack of availability of options for enriched organic fertilisers with essential nutrients for agricultural use.
  • Absence of economically viable mass production systems could lower the selling cost of biofertilisers.
  • Inadequate funds are spent on the promotion of bio and organic fertilisers despite various schemes for their promotion of them.
  • Lack of suitable infrastructure: Infrastructure support funds provided under schemes like the Capital Investment Subsidy Scheme and Soil Health Management have not seen much uptake in states and remain underutilised. Gaushalas and farmers cannot market compost and other organic fertiliser produced by them and there is no organised market and buyer for their produce.
  • Lack of extension and awareness on the use and benefits of organic and bio fertilisers amongst farming communities.
  • Issues of regulation: (i) FCO does not list some bio & organic fertilisers prepared from livestock waste such as Panchagavya, Dasagavya, Sheep & Goat Manure, Poultry Manure, Sanjivak, Gokripa Amrut, Amrit Pani, Fermented curd water, Ghanjivamrut, Crystallised cow urine. (ii) Lack of testing facilities and personnel and certification for organic and bio fertilisers in states which have slowed market prospects for manufacturers of organic fertilisers, especially PROM. (iii) Currently, the regulatory process for Bio and Organic fertilisers differs between states.

Way Forward

  • Digitisation of the whole process of manufacturing, license to sale authorisation to a dealer, stock records and maintenance, timely sampling by an inspector as per FCO with time-bound consultation with States.
  • Parity between inorganic and bio and organic fertilisers: There is a need for some parity in support for organic & bio fertilisers vis-a-vis organic, bio fertilisers and other animal waste-based compost, manures, jivamrit etc. This will also help cow farmers and cow shed owners earn extra income.
  • Marketing of bio & organic fertiliser: (i) Public sector fertiliser distribution agencies like IFFCO, KRIBHCO and such state-level agencies should be mandated to market standardised bio and organic fertilisers. (ii) A mechanism should be established to mandate fertiliser selling and manufacturing agencies to sell inorganic and organic fertiliser. (iii) Policy support to encourage commercial production, packaging, marketing & distribution of cow dung-based organic fertilisers including brand development. (iv) Gram panchayats should be involved in the production of organic and bio fertilisers at cow sheds.
  • Expanding the scope of FCO, 1985: (i) FCO, 1985 should be amended to include livestock waste fertilisers such as Panchagavya etc. (ii) Adequate testing facility should be created for manufacturers of organic and bio fertilisers. (iii) Quality certification of bio and organic fertilisers should be undertaken which would help farmers to identify safe and certified products. (iv) There is a need for uniformity in the regulatory process accommodating state specificities across India for registration and marketing of bio and organic fertilisers.
  • Incentives to encourage production and consumption of bio & organic fertilisers: (i) Extension of subsidy/market development assistance for bio fertiliser in line with city compost Rs 1500/ton. (ii) Mandatory 10-20% off-take of bio and organic fertiliser by fertiliser companies. (iii) Via gap funding to be provided to capital assistance and marketing of cow dung and cow-urine-based formulations for application in agriculture. (iv) Attracting the private sector to invest in mass-scale production of organic and bio fertilisers, bio pesticides, soil-enriching products and stimulants for use in agriculture.
  • Research & Development: (i) Improvement of efficiency of different formulations of organic and bio fertiliser. (ii) ICAR and other institutions should be encouraged to research organic & biofertilisers. (iii) These institutions should be encouraged to carry extension among farmers to take over bio and organic fertilisers.